
All Images
Python Notebook Introduction
Figure 1
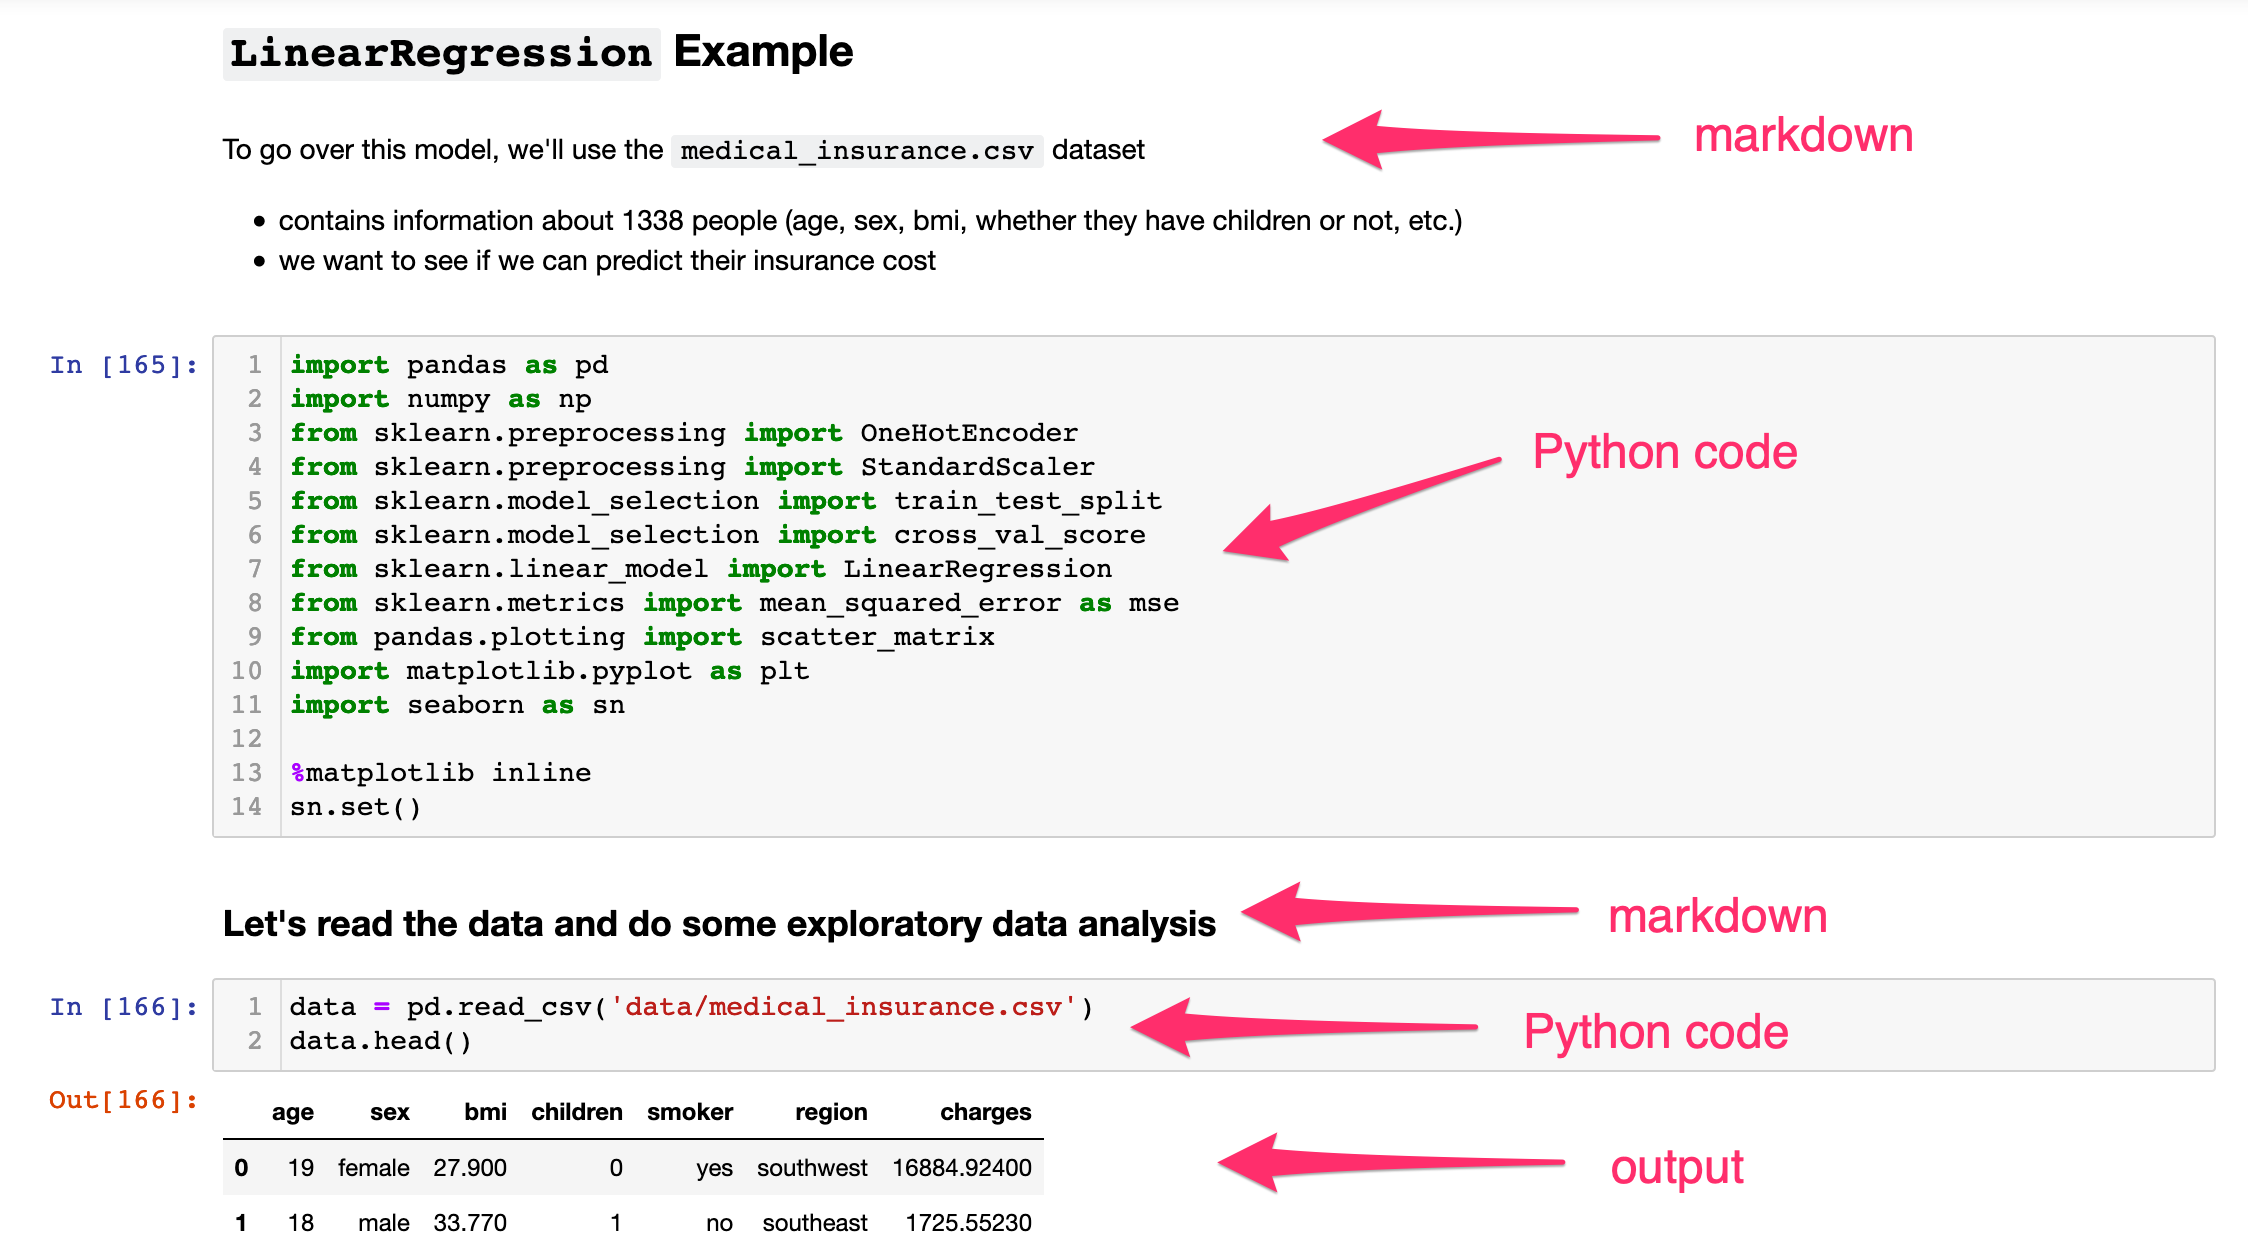
A Jupyter notebook with Markdown text cells,
Python code cells and a table of output, each labeled with an arrow.
Image source: Edlitera.
Figure 2
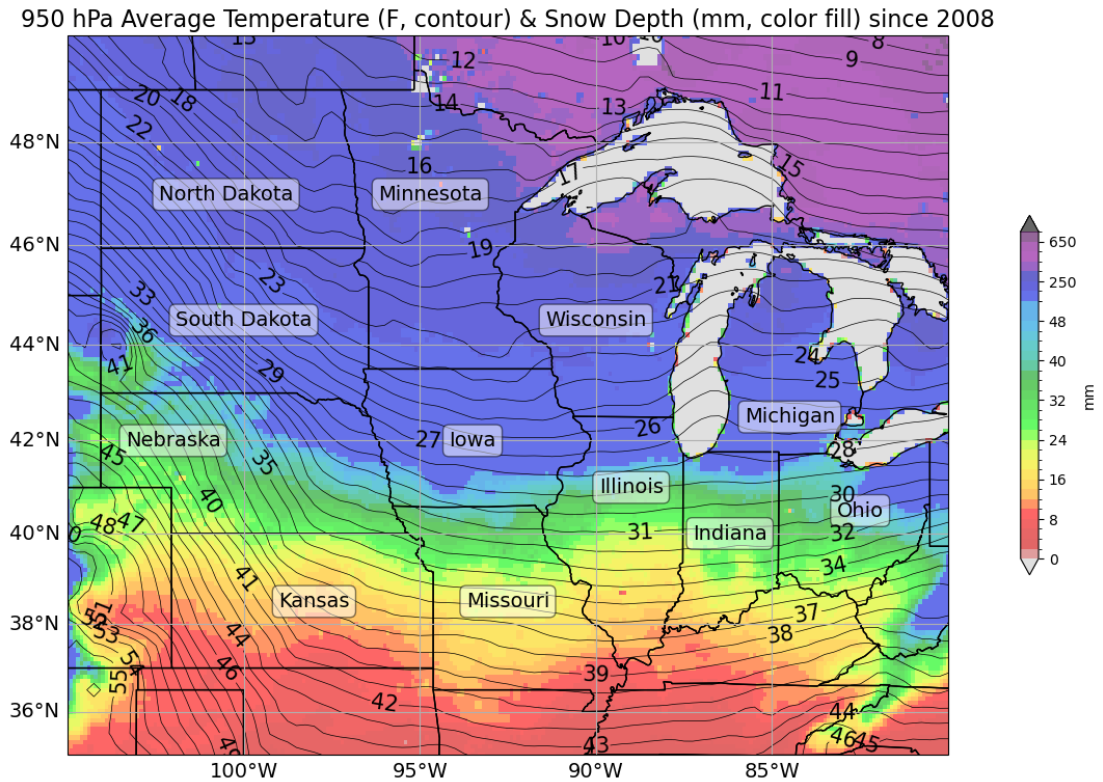
Average Temperatures and Snow Depth (mm) in
Midwest since 2008.
Figure 3
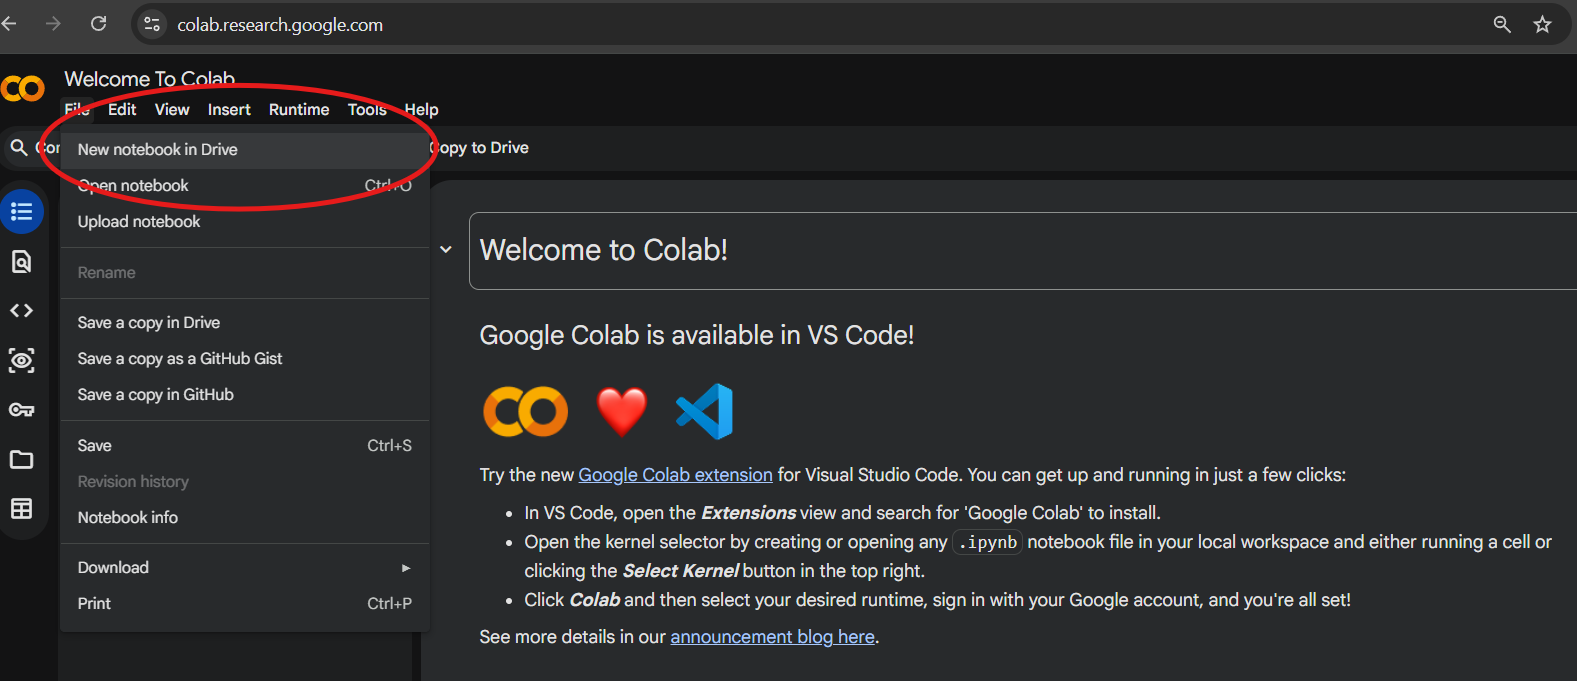
Opening a New Notebook in Colab.
Figure 4
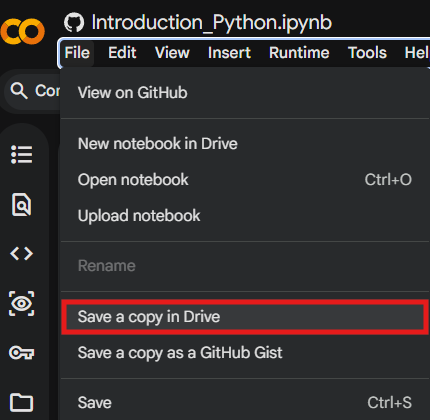
The Colab File menu with “Save a copy in Drive”
highlighted.
Acquiring and Exploring Census Data
Figure 1
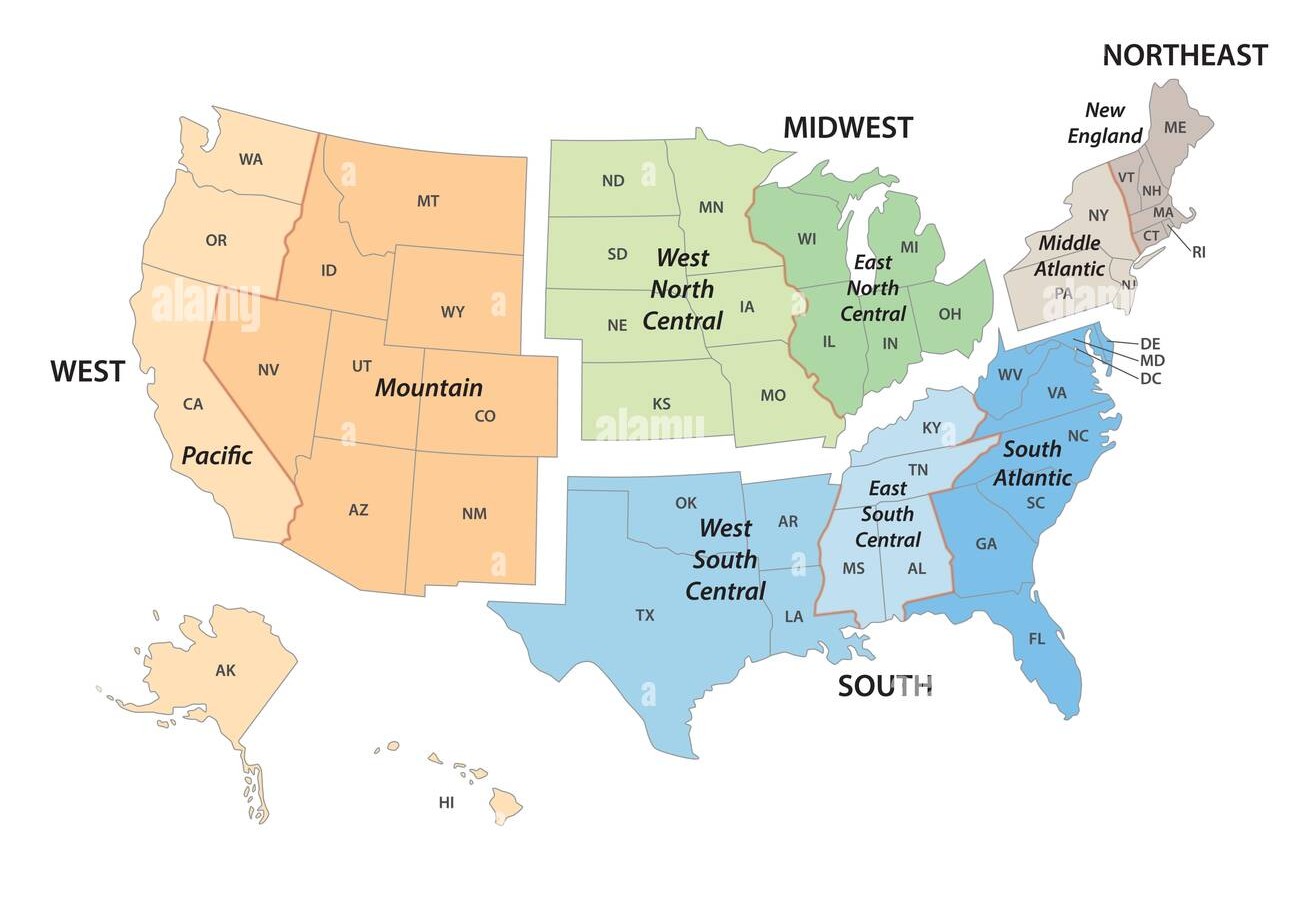
U.S. Census Bureau TIGER/Line boundaries of the
states, grouped into census regions.