
Quantum GIS Guide
Last updated on 2026-06-22 | Edit this page
Estimated time: 45 minutes
Overview
Questions
- What is QGIS and why is it useful?
- How do I install QGIS on my system?
- How do I load spatial data into QGIS?
- How can I style and visualize data on a map?
- How do I export a finished map?
Objectives
- Install QGIS successfully
- Understand the QGIS interface
- Load and explore spatial datasets
- Create and style a simple map
- Export a publication-ready map
What is QGIS?
QGIS (Quantum GIS) is a free, open-source Geographic Information System (GIS) used to:
- Visualize spatial data
- Analyze geographic patterns
- Create professional-quality maps
Why QGIS?
QGIS is widely used in academia, industry, and government — and it is completely free. It supports a wide range of vector and raster formats, connects to spatial databases, and has a rich plugin ecosystem.
Installing QGIS
Step 1: Download QGIS
Go to the official QGIS website: Here: https://qgis.org
Click Download Now
-
Choose the appropriate version for your operating system:
- Windows → Use the Standalone Installer (LTR) for the most stable release
- Mac → Download the macOS package
Which version should I choose?
QGIS offers a Latest Release and a Long Term Release (LTR). For workshops and beginners, the LTR is recommended because it is more stable and better tested.
Understanding the QGIS Interface
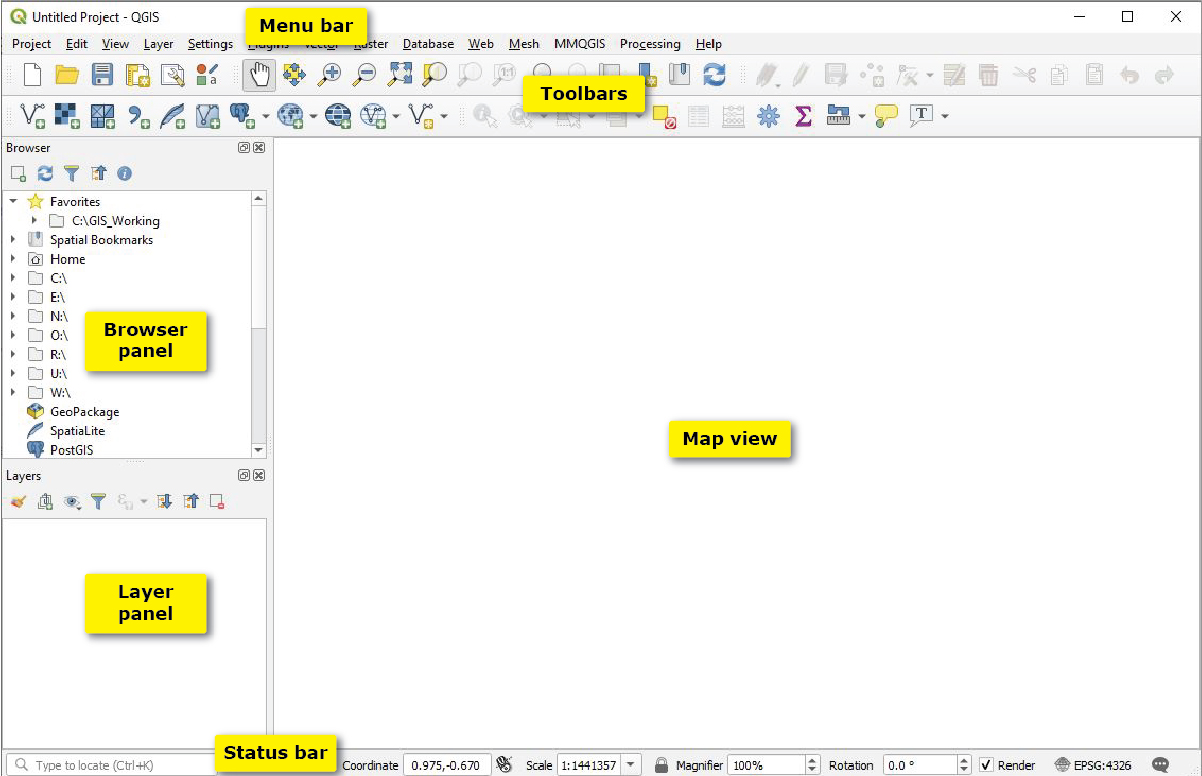
Key Components
- Map Canvas → The central area where your map is displayed
- Layers Panel → Shows all loaded datasets; controls layer visibility and order
- Browser Panel → Lets you navigate and access files on your system
- Toolbar → Tools for navigation, selection, and editing
Tip
If a panel is missing, you can enable it via View → Panels.
Loading Spatial Data
QGIS supports many spatial data formats. The most common are:
-
Shapefiles (
.shp) — a widely used vector format -
GeoJSON (
.geojson) — lightweight, text-based vector format -
GeoPackage (
.gpkg) — a modern, self-contained format (recommended) - CSV with coordinates — tabular data with latitude/longitude columns
-
Raster files (
.tif,.img) — gridded data such as satellite imagery or elevation models
Adding a Vector Layer
- Go to Layer → Add Layer → Add Vector Layer
- Browse to your file (e.g., a
.shpor.geojsonfile) - Click Add, then Close
The layer will appear in the Layers Panel and display on the Map Canvas.
Adding a CSV with Coordinates
- Go to Layer → Add Layer → Add Delimited Text Layer
- Select your
.csvfile - Set the X field (longitude) and Y field (latitude)
- Choose the appropriate coordinate reference system (CRS) —
EPSG:4326is common for lat/lon data - Click Add
Exercise 1: Load and Explore a Dataset
- Download a sample shapefile from a public source (your instructor will provide one, or try Natural Earth)
- Open QGIS and add the shapefile as a vector layer
- Right-click the layer in the Layers Panel and select Open Attribute Table
- Explore the data: How many features are there? What columns are available?
Styling and Visualizing Data
Once your data is loaded, you can change how it looks on the map.
Changing Layer Style
- Right-click the layer in the Layers Panel
- Select Properties → Symbology
- Choose a style type:
- Single Symbol — one color for all features
- Categorized — different colors by category (e.g., land use type)
- Graduated — a color ramp based on numeric values (e.g., population density)
- Adjust colors, borders, and opacity as needed
- Click Apply, then OK
Adding Labels
- Open Layer Properties → Labels
- Set the label type to Single Labels
- Choose the field to display (e.g., a name column)
- Adjust font size and placement as needed
- Click Apply
Exercise 2: Style Your Map
- Using the layer you loaded in Exercise 1, open the Symbology tab
- Change the style from Single Symbol to Categorized or Graduated (depending on your data)
- Choose a column to classify by and pick a color ramp
- Apply the style and observe how the map changes
- Add labels for a text field of your choice
Exporting a Map
QGIS includes a Print Layout tool for creating publication-ready maps.
Creating a Print Layout
- Go to Project → New Print Layout
- Give your layout a name and click OK
- The Print Layout window will open
Adding Map Elements
- Add the map: Go to Add Item → Add Map, then draw a rectangle on the canvas
- Add a title: Add Item → Add Label, then type your title
- Add a legend: Add Item → Add Legend
- Add a scale bar: Add Item → Add Scale Bar
- Add a north arrow: Add Item → Add North Arrow (or Add Picture and select a north arrow image)
Troubleshooting
- Layer not displaying? Check that the CRS matches your other layers. Right-click the layer → Set CRS → Set Layer CRS.
- QGIS running slowly? Large raster files or complex vector layers can slow things down. Try zooming into a smaller area or simplifying your data.
- Plugin not working? Go to Plugins → Manage and Install Plugins and check for updates.
- Need help? Raise your hand during the workshop.
- QGIS is a free, open-source GIS application suitable for mapping, visualization, and spatial analysis.
- Spatial data can be loaded from shapefiles, GeoJSON, GeoPackage, CSV, and raster formats.
- The Symbology panel controls how data appears on the map — use categorized or graduated styles to highlight patterns.
- The Print Layout tool lets you compose and export professional maps with titles, legends, and scale bars.