
All in One View
Content from Data Platforms
Last updated on 2026-06-22 | Edit this page
Estimated time: 15 minutes
Overview
Questions
- Where does geospatial and demographic data come from?
- Why do these platforms require accounts?
- How do these data sources connect to social science research?
Objectives
- Understand what each data platform provides and why it matters
- Know which platform to use for a given type of data
Overview
Throughout this workshop you will work with satellite imagery, elevation models, census demographics, and shared code. Each of these comes from a different platform, and each platform requires a free account so you can search, download, and use its data. This page explains what each platform offers and why it matters for social science research.
USGS EarthExplorer
EarthExplorer is run by the U.S. Geological Survey and is one of the largest public archives of remotely sensed data in the world. Through it you can access satellite imagery (Landsat, ASTER), aerial photography, and digital elevation models (DEMs) — all free of charge.
In social science research this data is useful for studying land use change over time, urban sprawl, environmental justice, disaster impacts, and the physical geography of the communities you are analyzing. During the workshop we will use EarthExplorer to download elevation data and satellite scenes that we then visualize and analyze in QGIS.
An account is required to download any data from the archive.
Copernicus Data Space
Copernicus is the European Union’s Earth observation programme. Its Data Space provides free access to imagery from the Sentinel satellite constellation, which captures the entire Earth’s surface every few days at high resolution.
Sentinel-2 imagery is especially valuable for monitoring vegetation health, water bodies, and land cover — all of which intersect with social science questions around agriculture, environmental policy, and community resilience. During the workshop we will use Sentinel-2 data alongside the Esri Sentinel-2 Explorer to visualize land use and land cover change.
An account is required to search and download Sentinel datasets.
U.S. Census Bureau API
👉 census.gov/data/developers.html
The Census Bureau API gives you programmatic access to the American Community Survey (ACS), the Decennial Census, and dozens of other demographic datasets — directly from Python code, without manually downloading files.
This is the backbone of quantitative social science research in the United States. With an API key you can pull population counts, income distributions, housing characteristics, and other variables at geographies ranging from the entire nation down to individual census tracts and block groups. During the workshop we will retrieve census data in a Jupyter Notebook, clean it, and produce maps and charts of population trends.
An API key is free and is required for any programmatic data retrieval.
GitHub
GitHub is a platform for version control and collaboration built on Git. It hosts code, documentation, and data files in repositories that can be shared, forked, and collaboratively edited.
For this workshop, GitHub serves two purposes. First, the exercise notebooks and workshop materials are hosted in GitHub repositories, and Google Colab pulls directly from them. Second, on Day 2 we will discuss how to share research outputs, manage Carpentries lesson modules, and collaborate on code — all of which rely on GitHub.
An account is required to fork repositories, contribute changes, and access certain materials.
- USGS EarthExplorer provides free satellite imagery and elevation data for studying landscapes and environmental change.
- Copernicus Data Space offers high-resolution, frequently updated Sentinel imagery for land cover and vegetation analysis.
- The Census Bureau API enables programmatic access to U.S. demographic data at fine geographic scales.
- GitHub hosts the workshop materials and supports collaborative sharing of code and research outputs.
Content from Quantum GIS Guide
Last updated on 2026-06-22 | Edit this page
Estimated time: 45 minutes
Overview
Questions
- What is QGIS and why is it useful?
- How do I install QGIS on my system?
- How do I load spatial data into QGIS?
- How can I style and visualize data on a map?
- How do I export a finished map?
Objectives
- Install QGIS successfully
- Understand the QGIS interface
- Load and explore spatial datasets
- Create and style a simple map
- Export a publication-ready map
What is QGIS?
QGIS (Quantum GIS) is a free, open-source Geographic Information System (GIS) used to:
- Visualize spatial data
- Analyze geographic patterns
- Create professional-quality maps
Why QGIS?
QGIS is widely used in academia, industry, and government — and it is completely free. It supports a wide range of vector and raster formats, connects to spatial databases, and has a rich plugin ecosystem.
Installing QGIS
Step 1: Download QGIS
Go to the official QGIS website: Here: https://qgis.org
Click Download Now
-
Choose the appropriate version for your operating system:
- Windows → Use the Standalone Installer (LTR) for the most stable release
- Mac → Download the macOS package
Which version should I choose?
QGIS offers a Latest Release and a Long Term Release (LTR). For workshops and beginners, the LTR is recommended because it is more stable and better tested.
Understanding the QGIS Interface
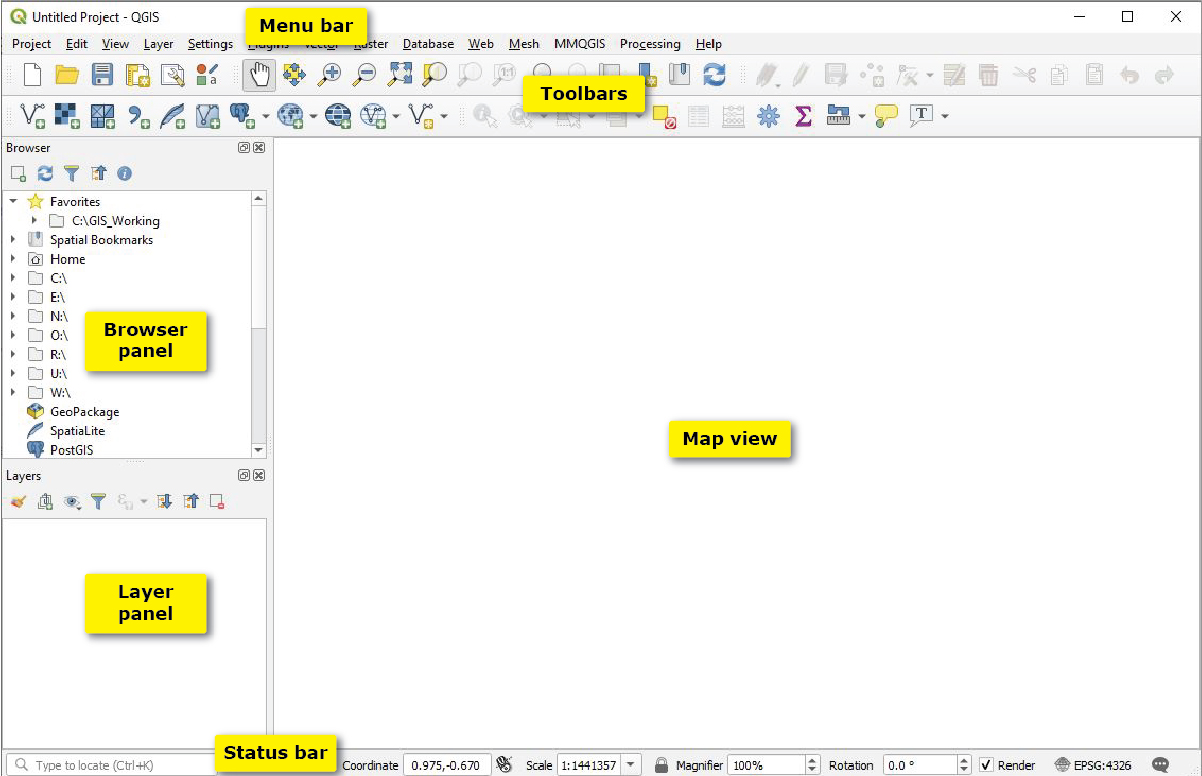
Key Components
- Map Canvas → The central area where your map is displayed
- Layers Panel → Shows all loaded datasets; controls layer visibility and order
- Browser Panel → Lets you navigate and access files on your system
- Toolbar → Tools for navigation, selection, and editing
Tip
If a panel is missing, you can enable it via View → Panels.
Loading Spatial Data
QGIS supports many spatial data formats. The most common are:
-
Shapefiles (
.shp) — a widely used vector format -
GeoJSON (
.geojson) — lightweight, text-based vector format -
GeoPackage (
.gpkg) — a modern, self-contained format (recommended) - CSV with coordinates — tabular data with latitude/longitude columns
-
Raster files (
.tif,.img) — gridded data such as satellite imagery or elevation models
Adding a Vector Layer
- Go to Layer → Add Layer → Add Vector Layer
- Browse to your file (e.g., a
.shpor.geojsonfile) - Click Add, then Close
The layer will appear in the Layers Panel and display on the Map Canvas.
Adding a CSV with Coordinates
- Go to Layer → Add Layer → Add Delimited Text Layer
- Select your
.csvfile - Set the X field (longitude) and Y field (latitude)
- Choose the appropriate coordinate reference system (CRS) —
EPSG:4326is common for lat/lon data - Click Add
Exercise 1: Load and Explore a Dataset
- Download a sample shapefile from a public source (your instructor will provide one, or try Natural Earth)
- Open QGIS and add the shapefile as a vector layer
- Right-click the layer in the Layers Panel and select Open Attribute Table
- Explore the data: How many features are there? What columns are available?
Styling and Visualizing Data
Once your data is loaded, you can change how it looks on the map.
Changing Layer Style
- Right-click the layer in the Layers Panel
- Select Properties → Symbology
- Choose a style type:
- Single Symbol — one color for all features
- Categorized — different colors by category (e.g., land use type)
- Graduated — a color ramp based on numeric values (e.g., population density)
- Adjust colors, borders, and opacity as needed
- Click Apply, then OK
Adding Labels
- Open Layer Properties → Labels
- Set the label type to Single Labels
- Choose the field to display (e.g., a name column)
- Adjust font size and placement as needed
- Click Apply
Exercise 2: Style Your Map
- Using the layer you loaded in Exercise 1, open the Symbology tab
- Change the style from Single Symbol to Categorized or Graduated (depending on your data)
- Choose a column to classify by and pick a color ramp
- Apply the style and observe how the map changes
- Add labels for a text field of your choice
Exporting a Map
QGIS includes a Print Layout tool for creating publication-ready maps.
Creating a Print Layout
- Go to Project → New Print Layout
- Give your layout a name and click OK
- The Print Layout window will open
Adding Map Elements
- Add the map: Go to Add Item → Add Map, then draw a rectangle on the canvas
- Add a title: Add Item → Add Label, then type your title
- Add a legend: Add Item → Add Legend
- Add a scale bar: Add Item → Add Scale Bar
- Add a north arrow: Add Item → Add North Arrow (or Add Picture and select a north arrow image)
Troubleshooting
- Layer not displaying? Check that the CRS matches your other layers. Right-click the layer → Set CRS → Set Layer CRS.
- QGIS running slowly? Large raster files or complex vector layers can slow things down. Try zooming into a smaller area or simplifying your data.
- Plugin not working? Go to Plugins → Manage and Install Plugins and check for updates.
- Need help? Raise your hand during the workshop.
- QGIS is a free, open-source GIS application suitable for mapping, visualization, and spatial analysis.
- Spatial data can be loaded from shapefiles, GeoJSON, GeoPackage, CSV, and raster formats.
- The Symbology panel controls how data appears on the map — use categorized or graduated styles to highlight patterns.
- The Print Layout tool lets you compose and export professional maps with titles, legends, and scale bars.
Content from Python Notebook Refresher
Last updated on 2026-06-23 | Edit this page
Estimated time: 30 minutes
Overview
Questions
- Can I write and run Python code in a Jupyter Notebook?
- Do I understand how variables persist across cells?
- Can I create a basic plot?
Objectives
- Verify your Python and Jupyter skills before the workshop
- Complete three self-check exercises covering basic coding, variables, and plotting
Overview
This page is a quick refresher, not a full tutorial. You should already be comfortable with basic Python — variables, data types, imports, and simple operations. If any of the exercises below feel unfamiliar, please review a Python fundamentals tutorial before the workshop.
We will be using Google Colab for all notebook activities. Colab runs in your browser and requires no installation — just a Google account.
Quick Reminders
Cells are the building blocks of a notebook. Code cells run Python; Markdown cells hold formatted text.
Running a cell: Shift + Enter runs the
current cell and moves to the next.
Statefulness: The notebook kernel remembers
variables across cells. If you run a cell that sets x = 5,
every cell after that can use x — until you restart the
kernel.
Restart & Run All: Before sharing or submitting a notebook, always restart the kernel and run all cells from top to bottom to make sure everything works in order.
Exercise 1: Python Coding
Covers basic syntax, printing, and simple operations.
Exercise 2: Variable Handling
Covers how data is stored, updated, and reused across cells.
Exercise 3: Python Plotting
Covers creating basic charts with matplotlib.
- Jupyter Notebooks let you run Python code in small, interactive cells.
- Variables persist across cells — execution order matters.
- If all three exercises felt comfortable, you are ready for the workshop.