
Summary and Schedule
This is a new lesson built with The Carpentries Workbench.
| Setup Instructions | Download files required for the lesson | |
| Duration: 00h 00m | 1. Exercises: NDVI Analysis with Sentinel-2 Imagery |
What is NDVI and what does it measure? How do I calculate NDVI from Sentinel-2 bands in QGIS? How do I interpret and visualize NDVI results? |
| Duration: 00h 45m | 2. Exercises: Flood Analysis with False Color Composites and NDWI |
What is a false color composite and what does it reveal? How do I create a false color composite from Sentinel-2 bands in QGIS? What is NDWI and how does it differ from NDVI? How can NDWI help identify flood extent more accurately than a false color composite alone? |
| Duration: 01h 30m | Finish |
The actual schedule may vary slightly depending on the topics and exercises chosen by the instructor.
What You Need for This Session
Session 3a builds directly on the DEM and Sentinel-2 data you worked with in Session 2a. Make sure you have the following ready before the session begins.
Accounts
- Copernicus Data Space — for accessing Sentinel-2 imagery. If you have not yet registered, create a free account at https://dataspace.copernicus.eu.
Data
-
Sentinel-2 image for the NDVI exercise — download
the ZIP file
S2B_MSIL1C_20260617T170849_N0512_R112_T14SPG_20260617T203803.SAFE.zipfrom the workshop’s participant resources Google Drive under Day 1_Session 3a: Basic raster functions. Save it to a new folder on your desktop called NDVI_Analysis locally. - SRTM DEM tile — you should already have this from Session 2a. If not, download one from USGS EarthExplorer following the instructions in the Session 2a episode.
Background Reading
The following article provides useful context on the satellite imagery sources and elevation products we use in this session:
Lindsay I, Mkrtchyan A. Free and Low-Cost Aerial Remote Sensing in Archaeology: An Overview of Data Sources and Recent Applications in the South Caucasus. Advances in Archaeological Practice. 2023;11(2):164-183. https://doi.org/10.1017/aap.2023.3
Two figures from this article are especially relevant to our session:
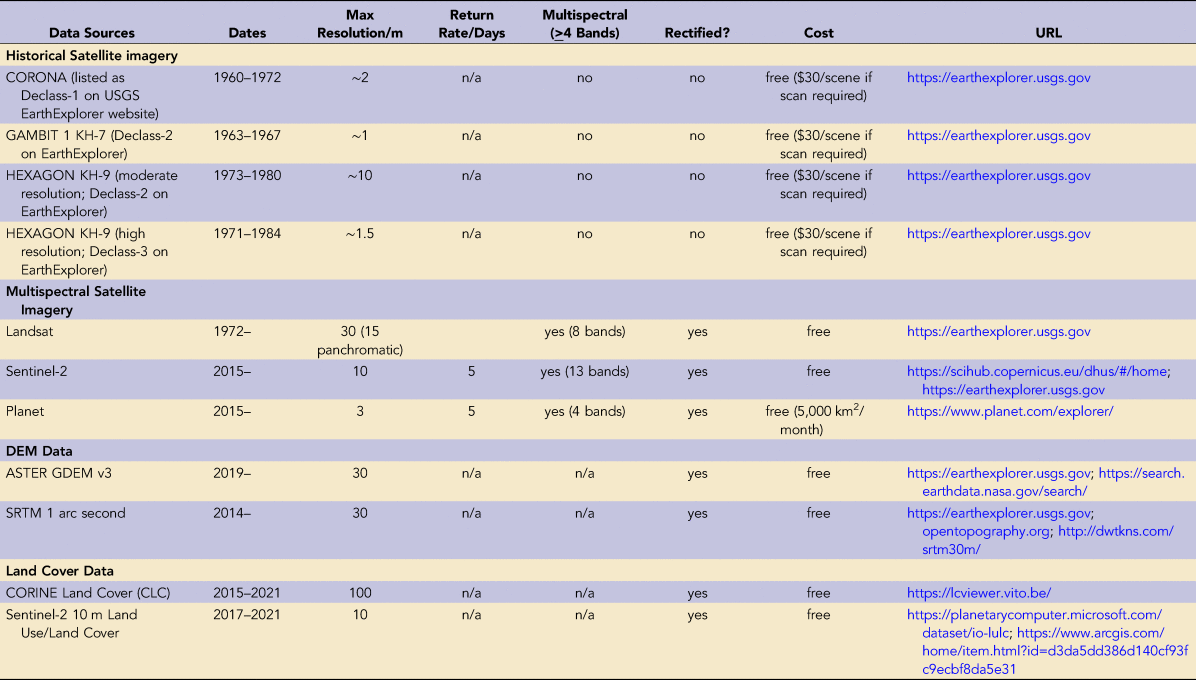
Free and low-cost satellite imagery sources
commonly used in archaeological and heritage applications.
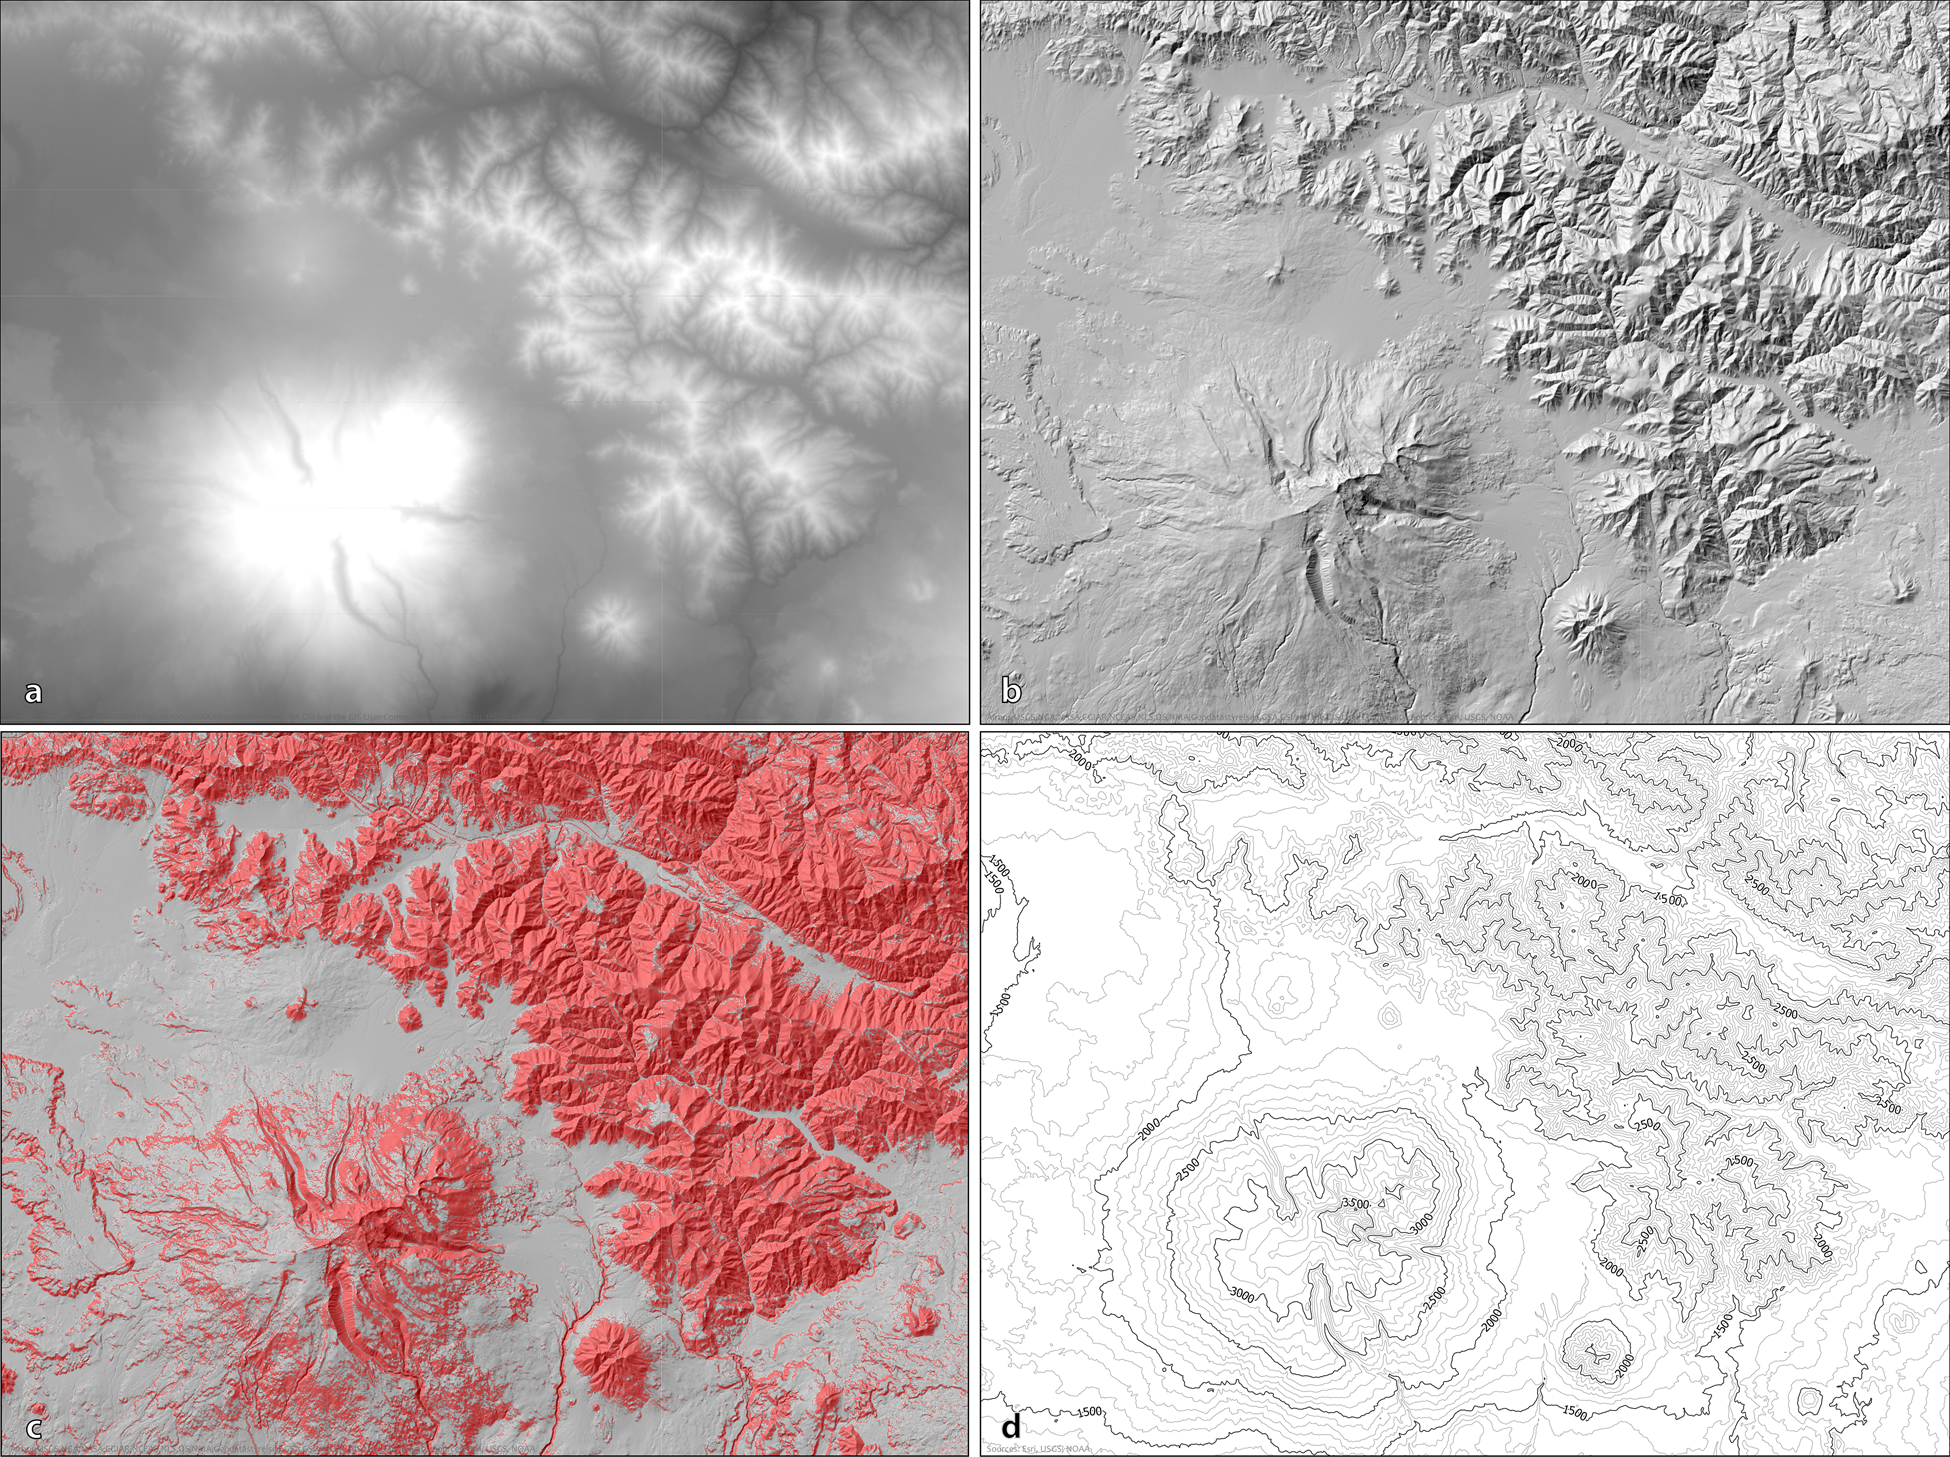
SRTM digital elevation model of the Mount
Aragats region of Armenia and examples of common elevation products
derived from the model: (a) raw SRTM DEM data; (b) hillshade; (c) slope
calculated as percent, with slopes greater than 15% in red; (d) contour
lines.
These examples illustrate the range of analysis you can perform with freely available satellite and elevation data — the same tools and data sources we use in this workshop.