
All Images
Exercises: NDVI Analysis with Sentinel-2 Imagery
Figure 1
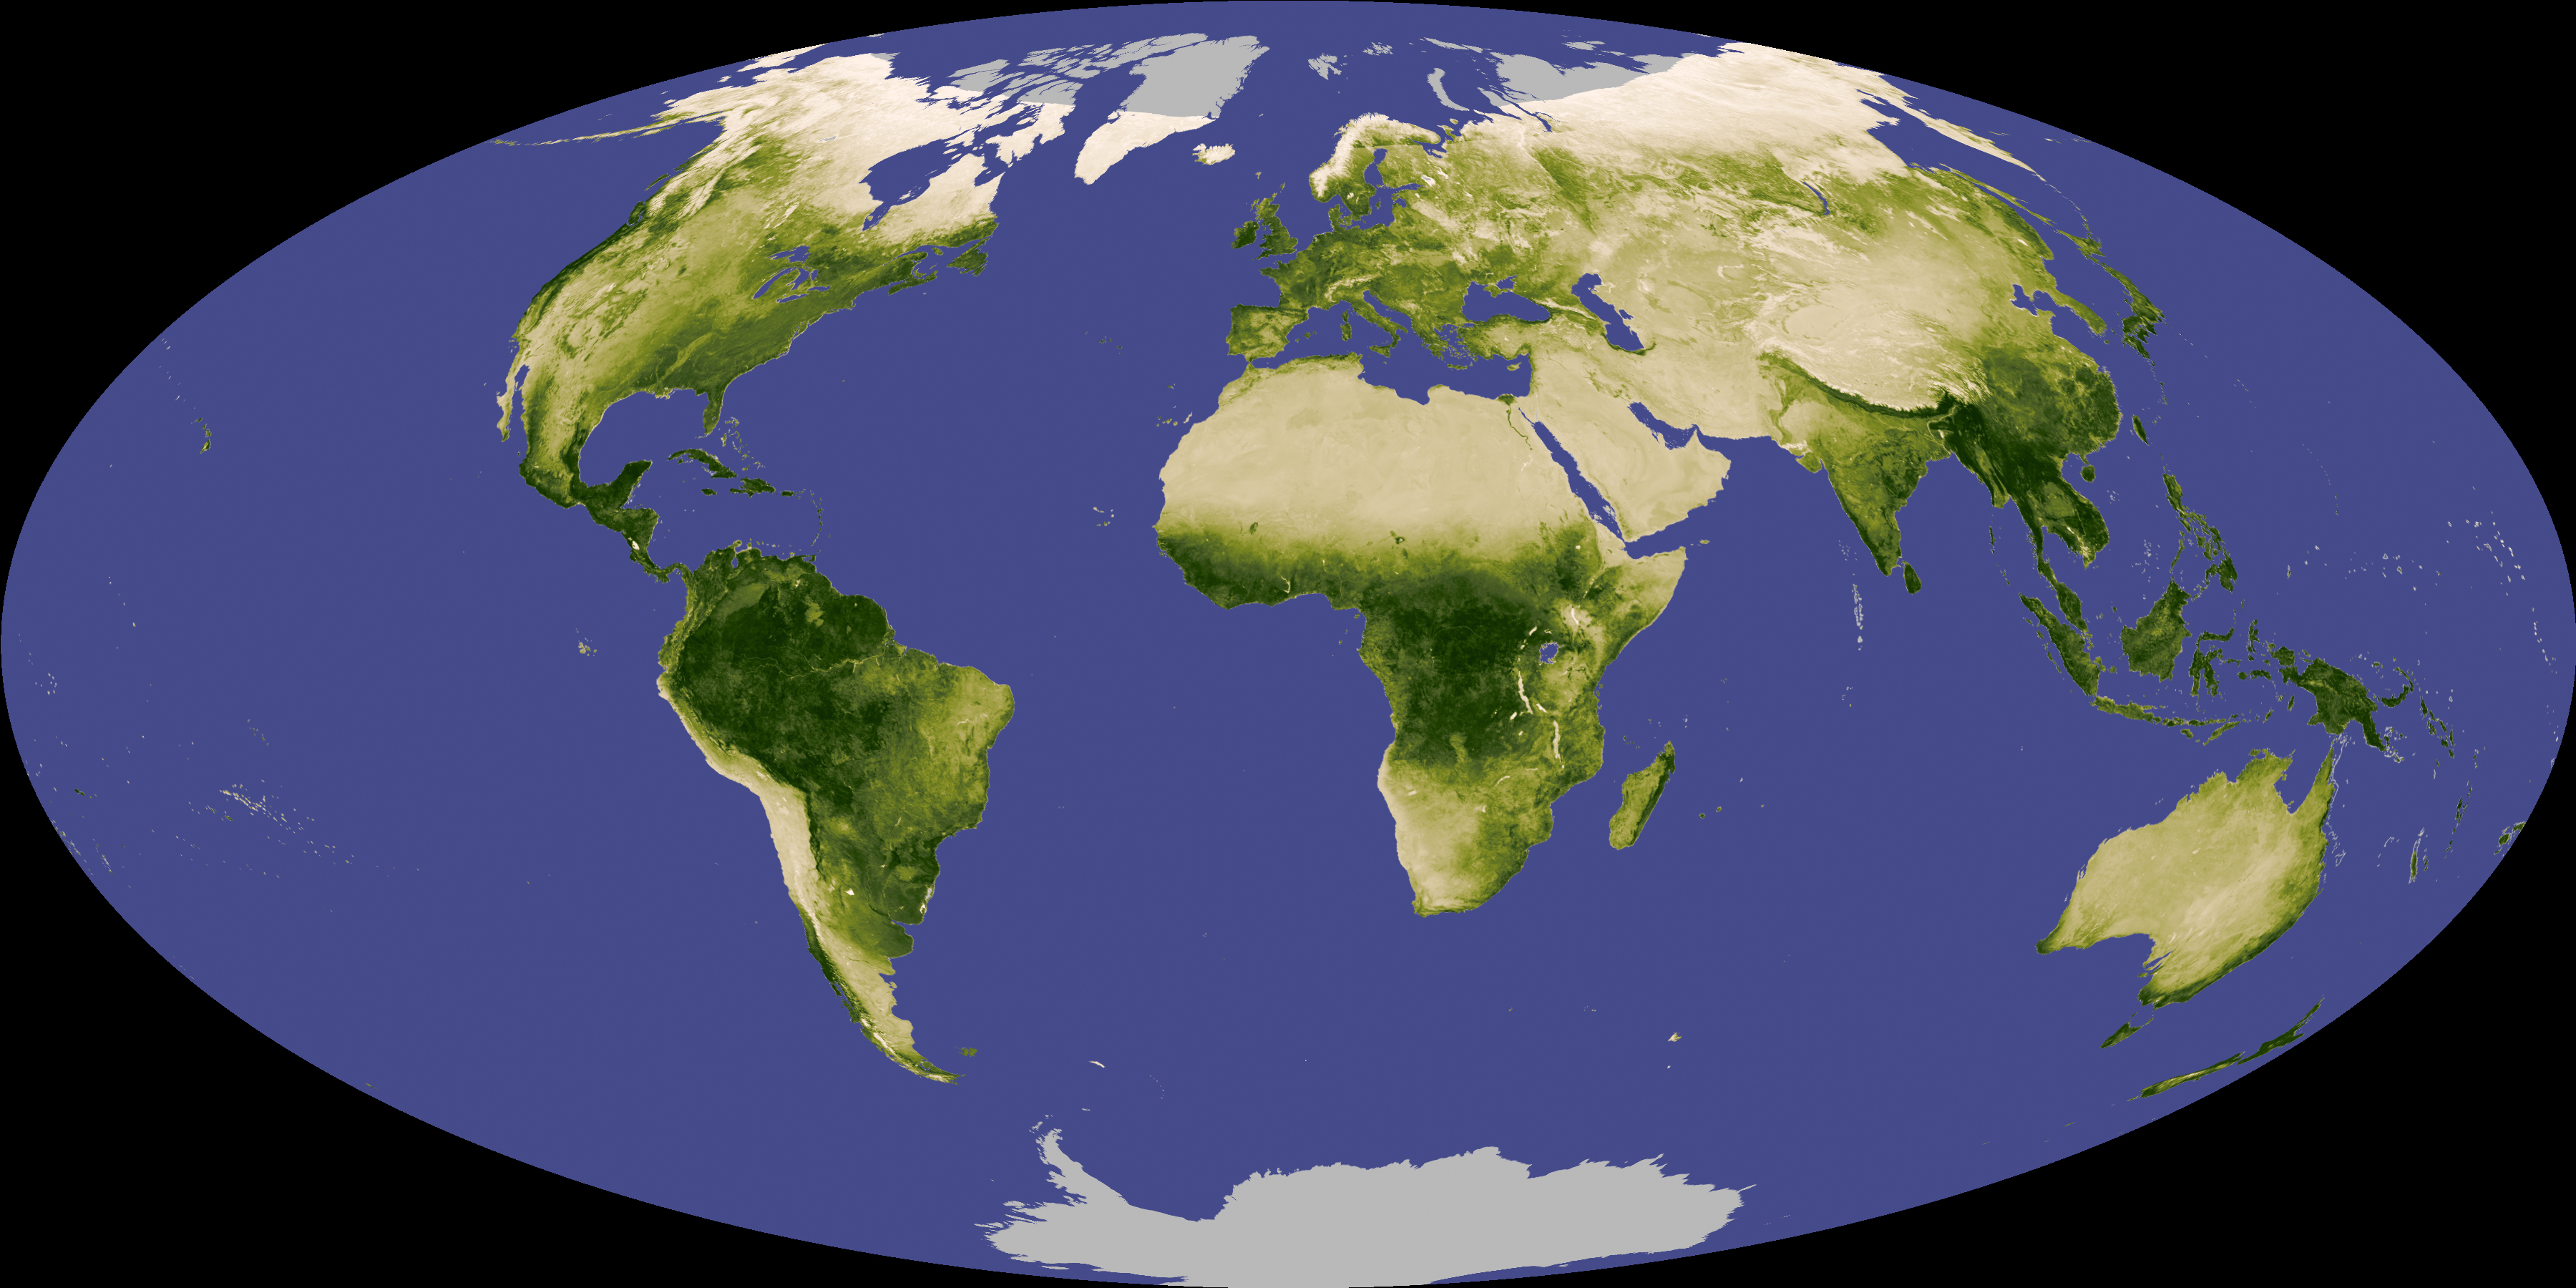
Global NDVI composite showing vegetation density
across the Earth’s surface.
Figure 2
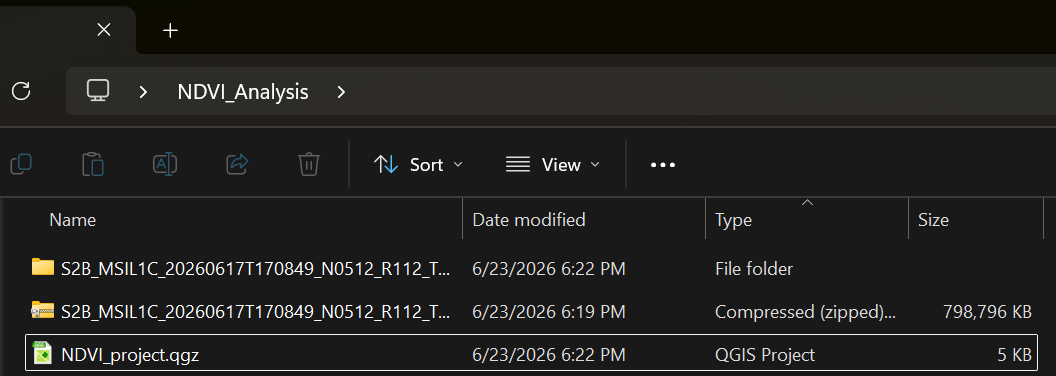
The NDVI_Analysis folder with the extracted
Sentinel-2 data.
Figure 3
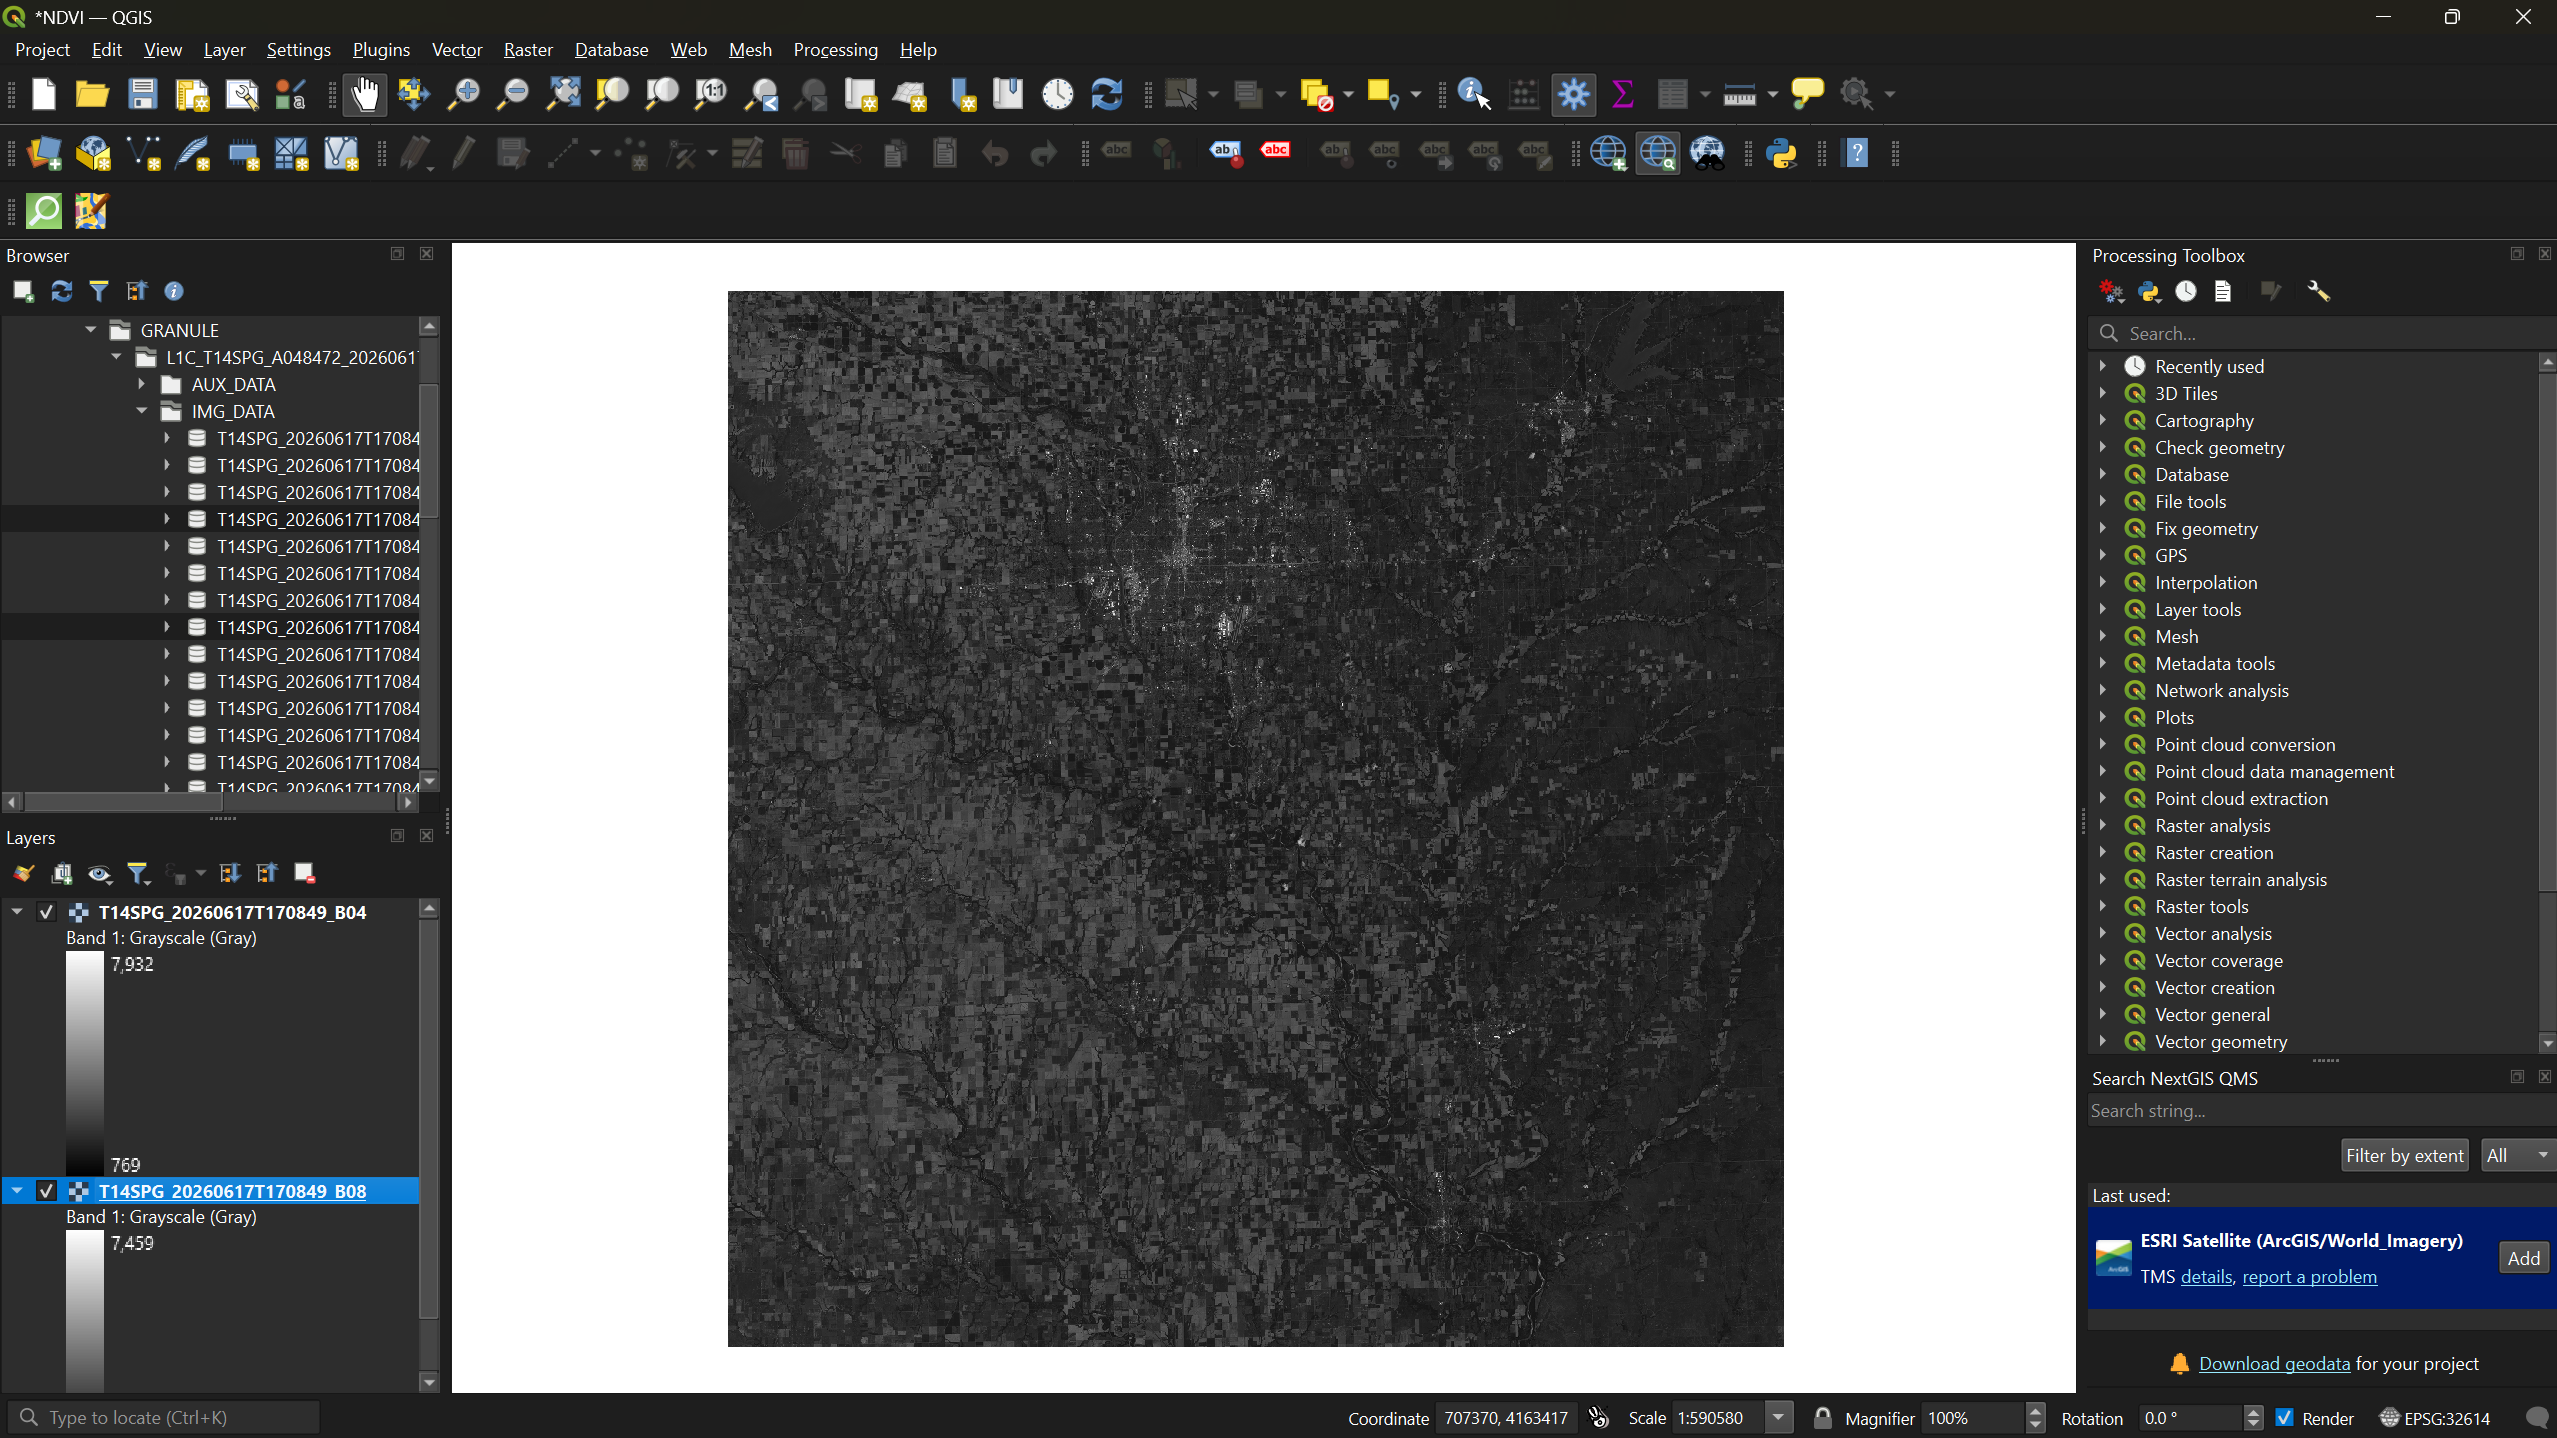
Bands 4 and 8 loaded into QGIS.
Figure 4
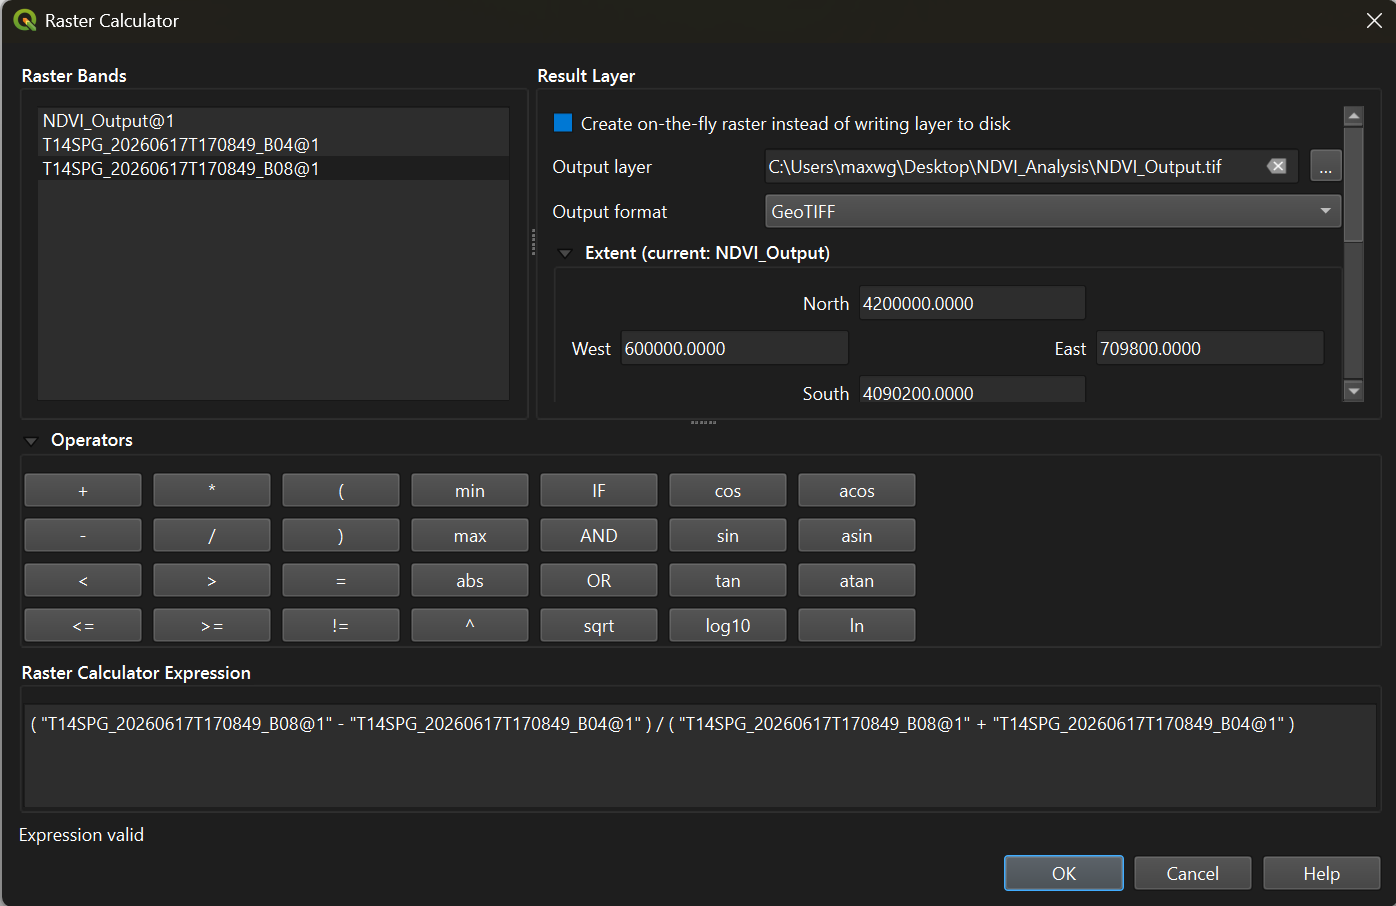
The Raster Calculator with the NDVI expression
entered.
Figure 5
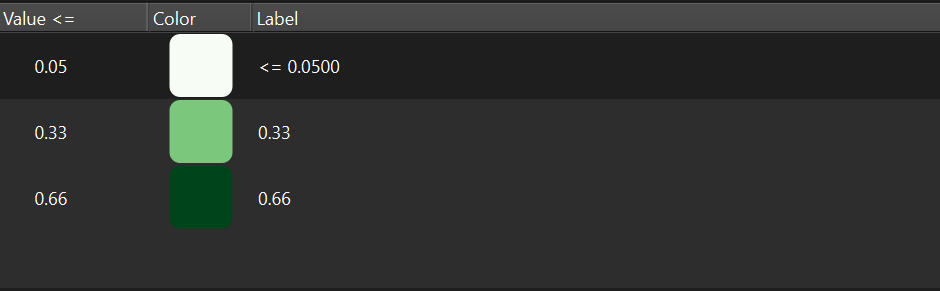
The symbology popup with three NDVI classes
configured.
Figure 6
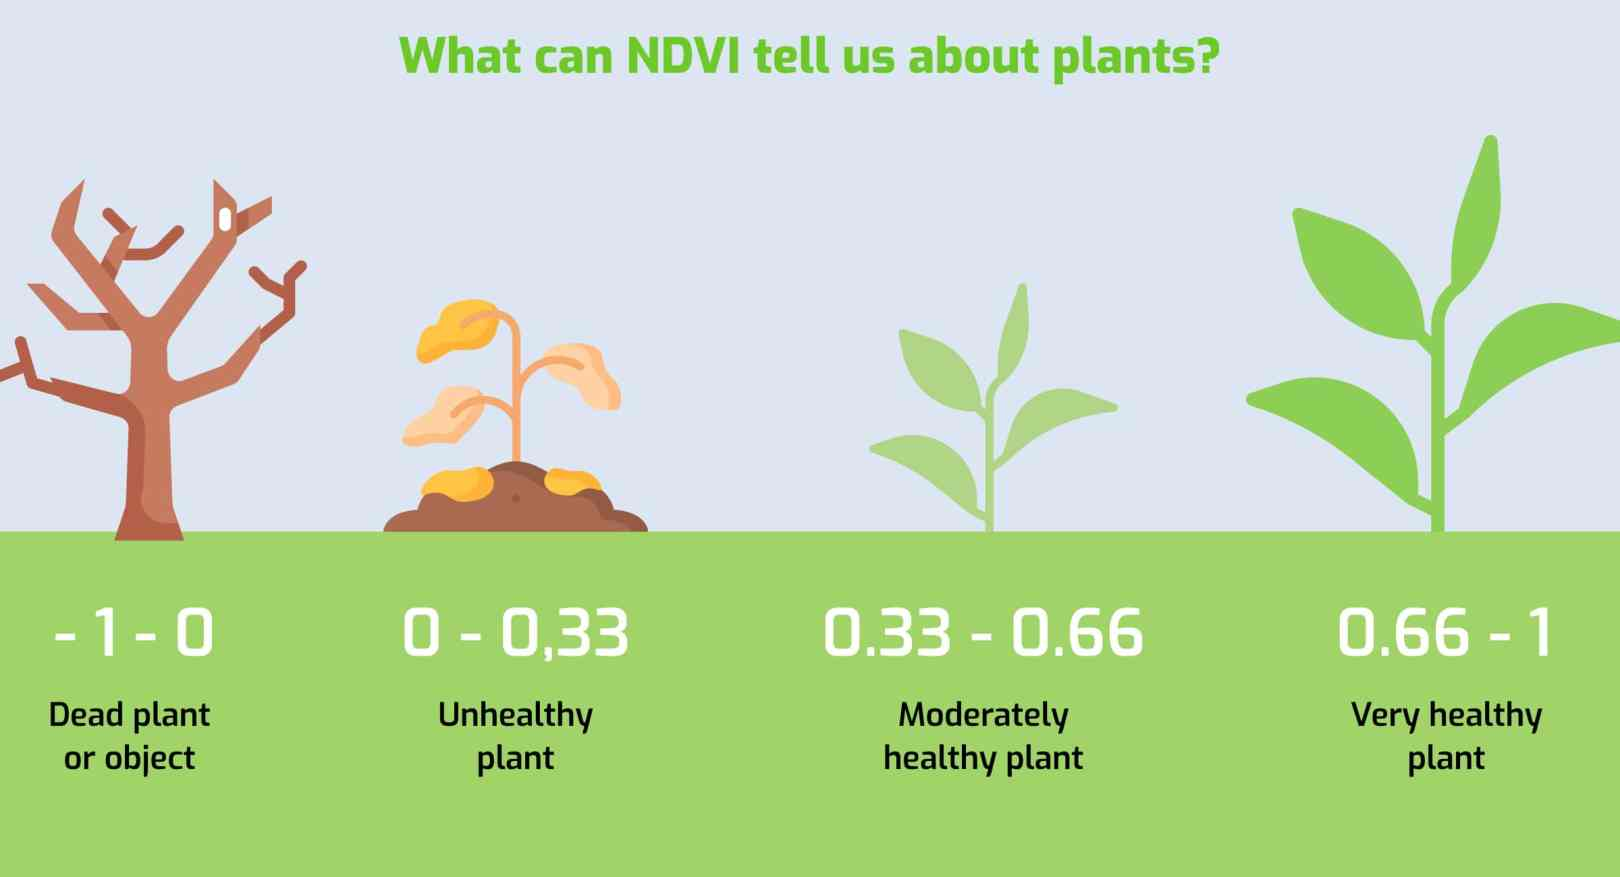
NDVI reference scale showing the relationship
between NDVI values and vegetation health.
Figure 7
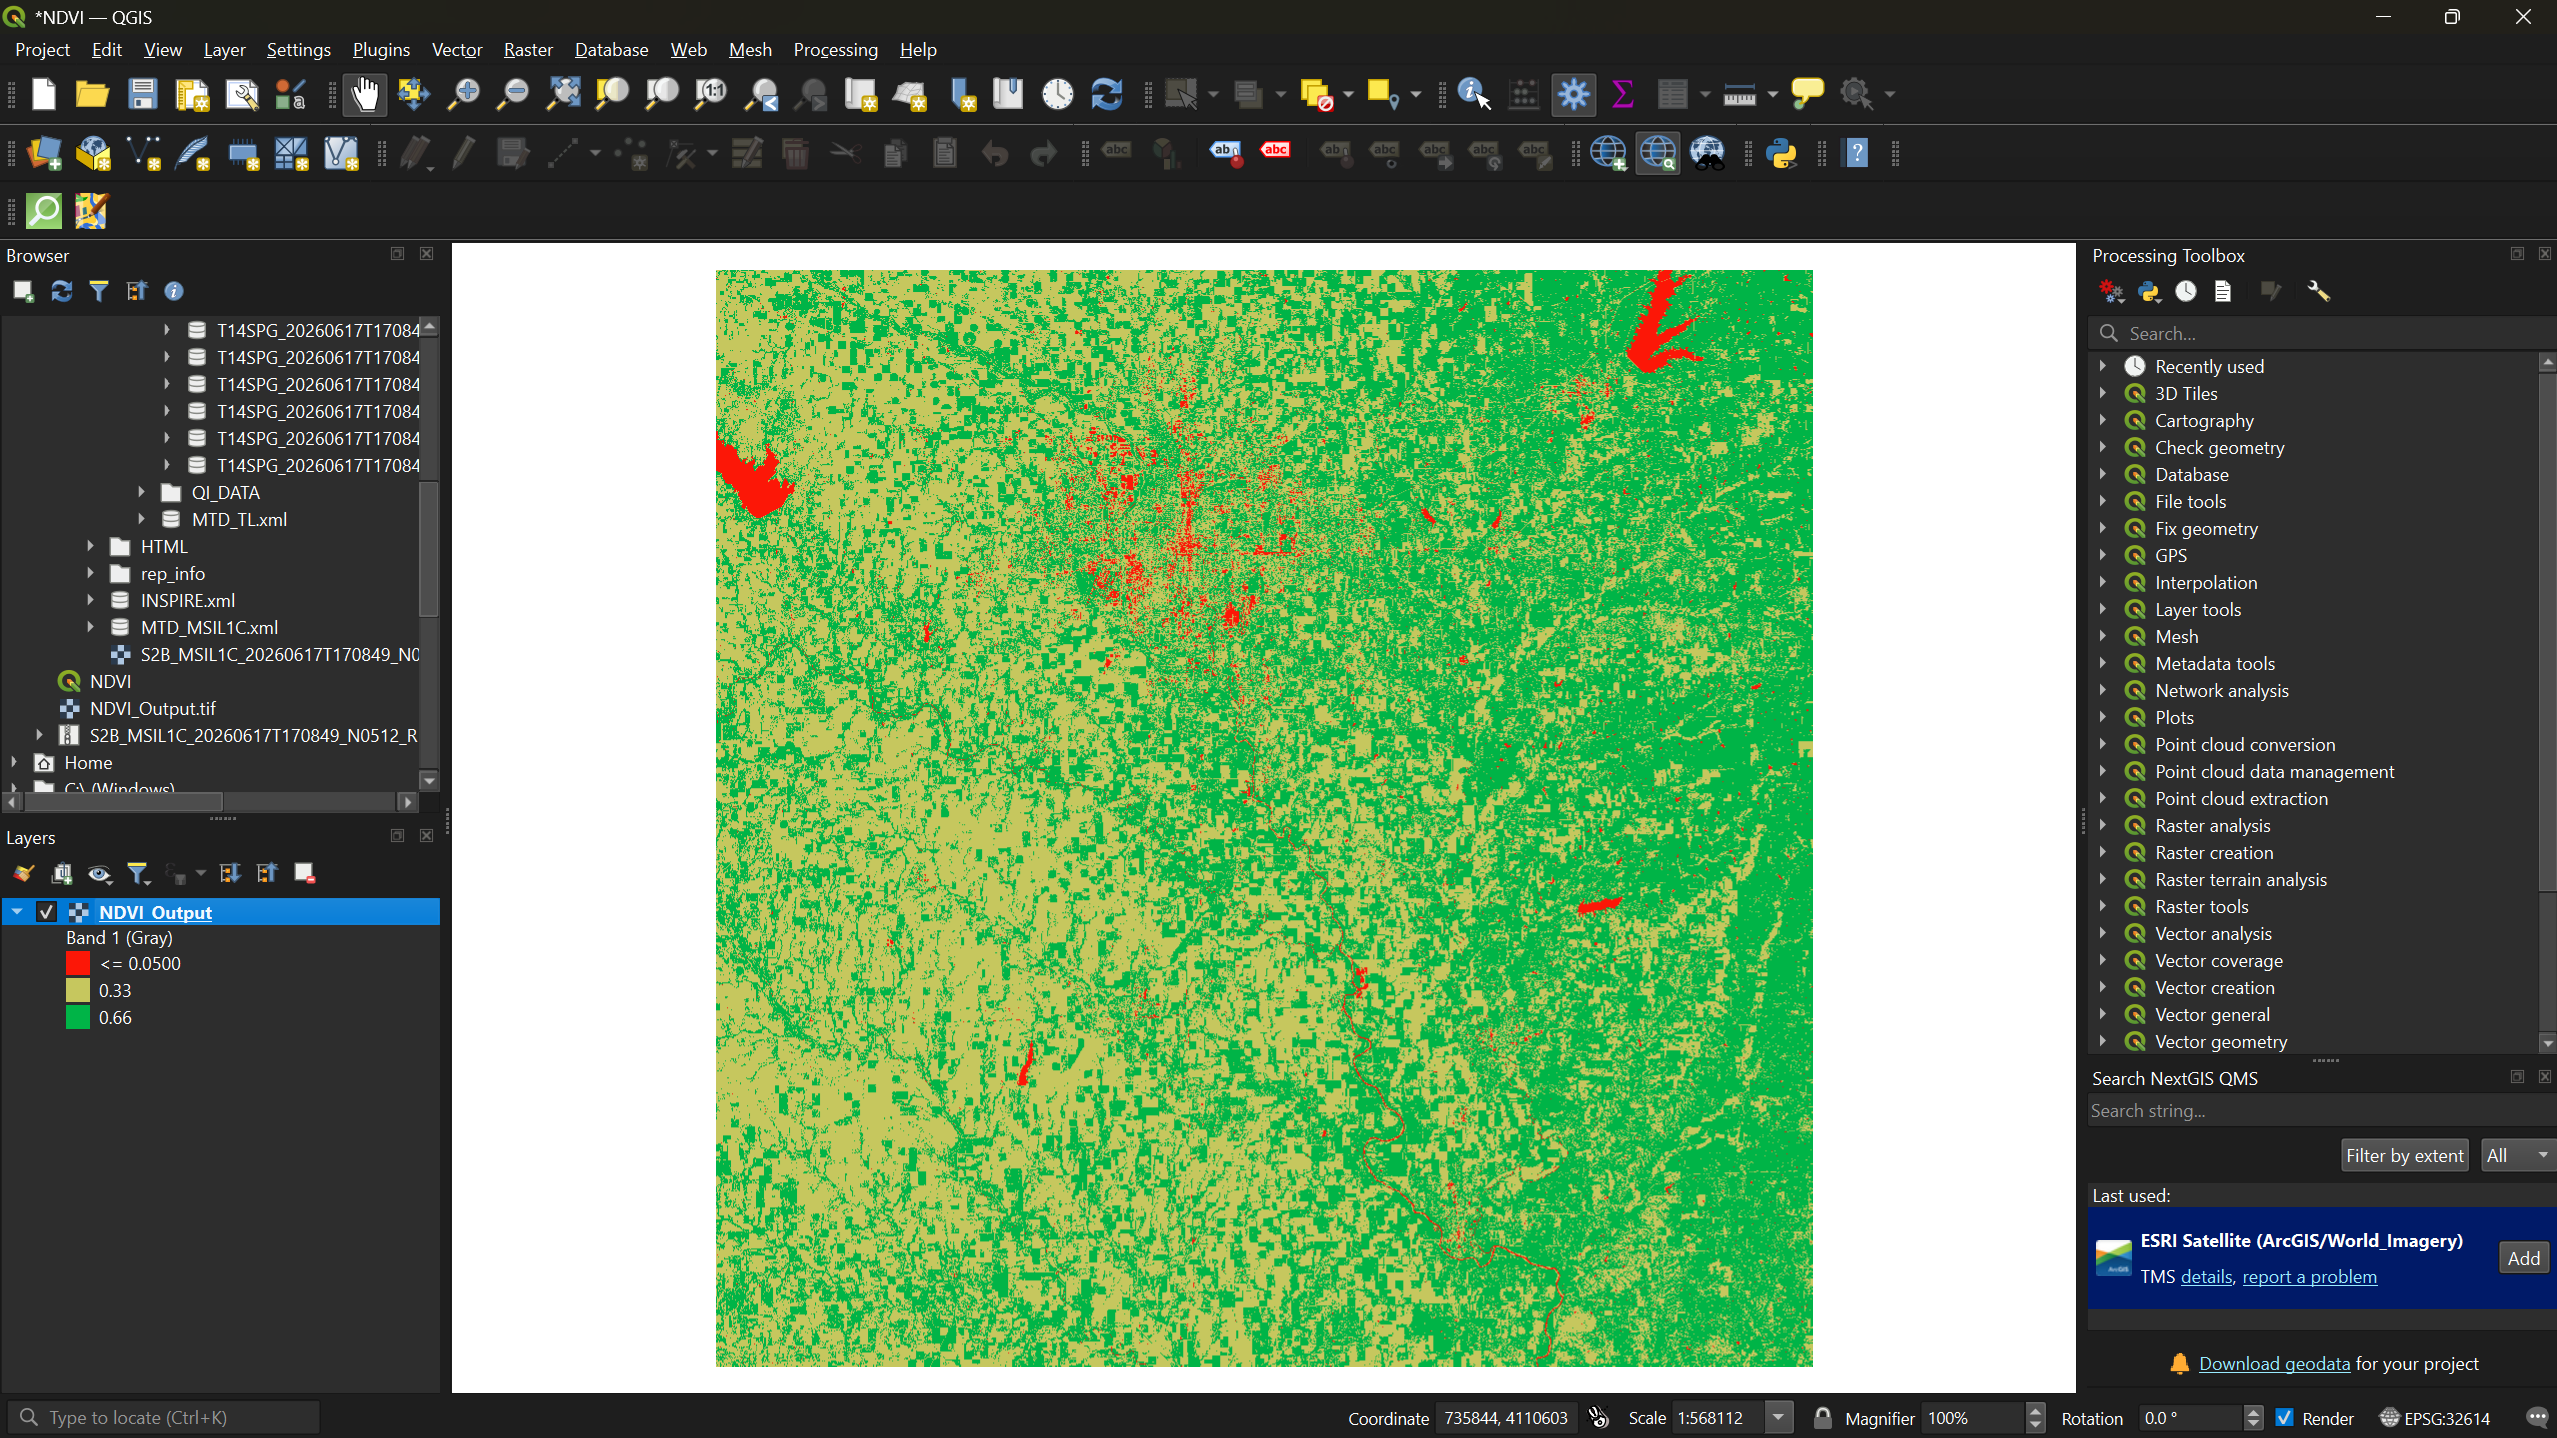
The NDVI result with red-yellow-green symbology
applied.
Figure 8
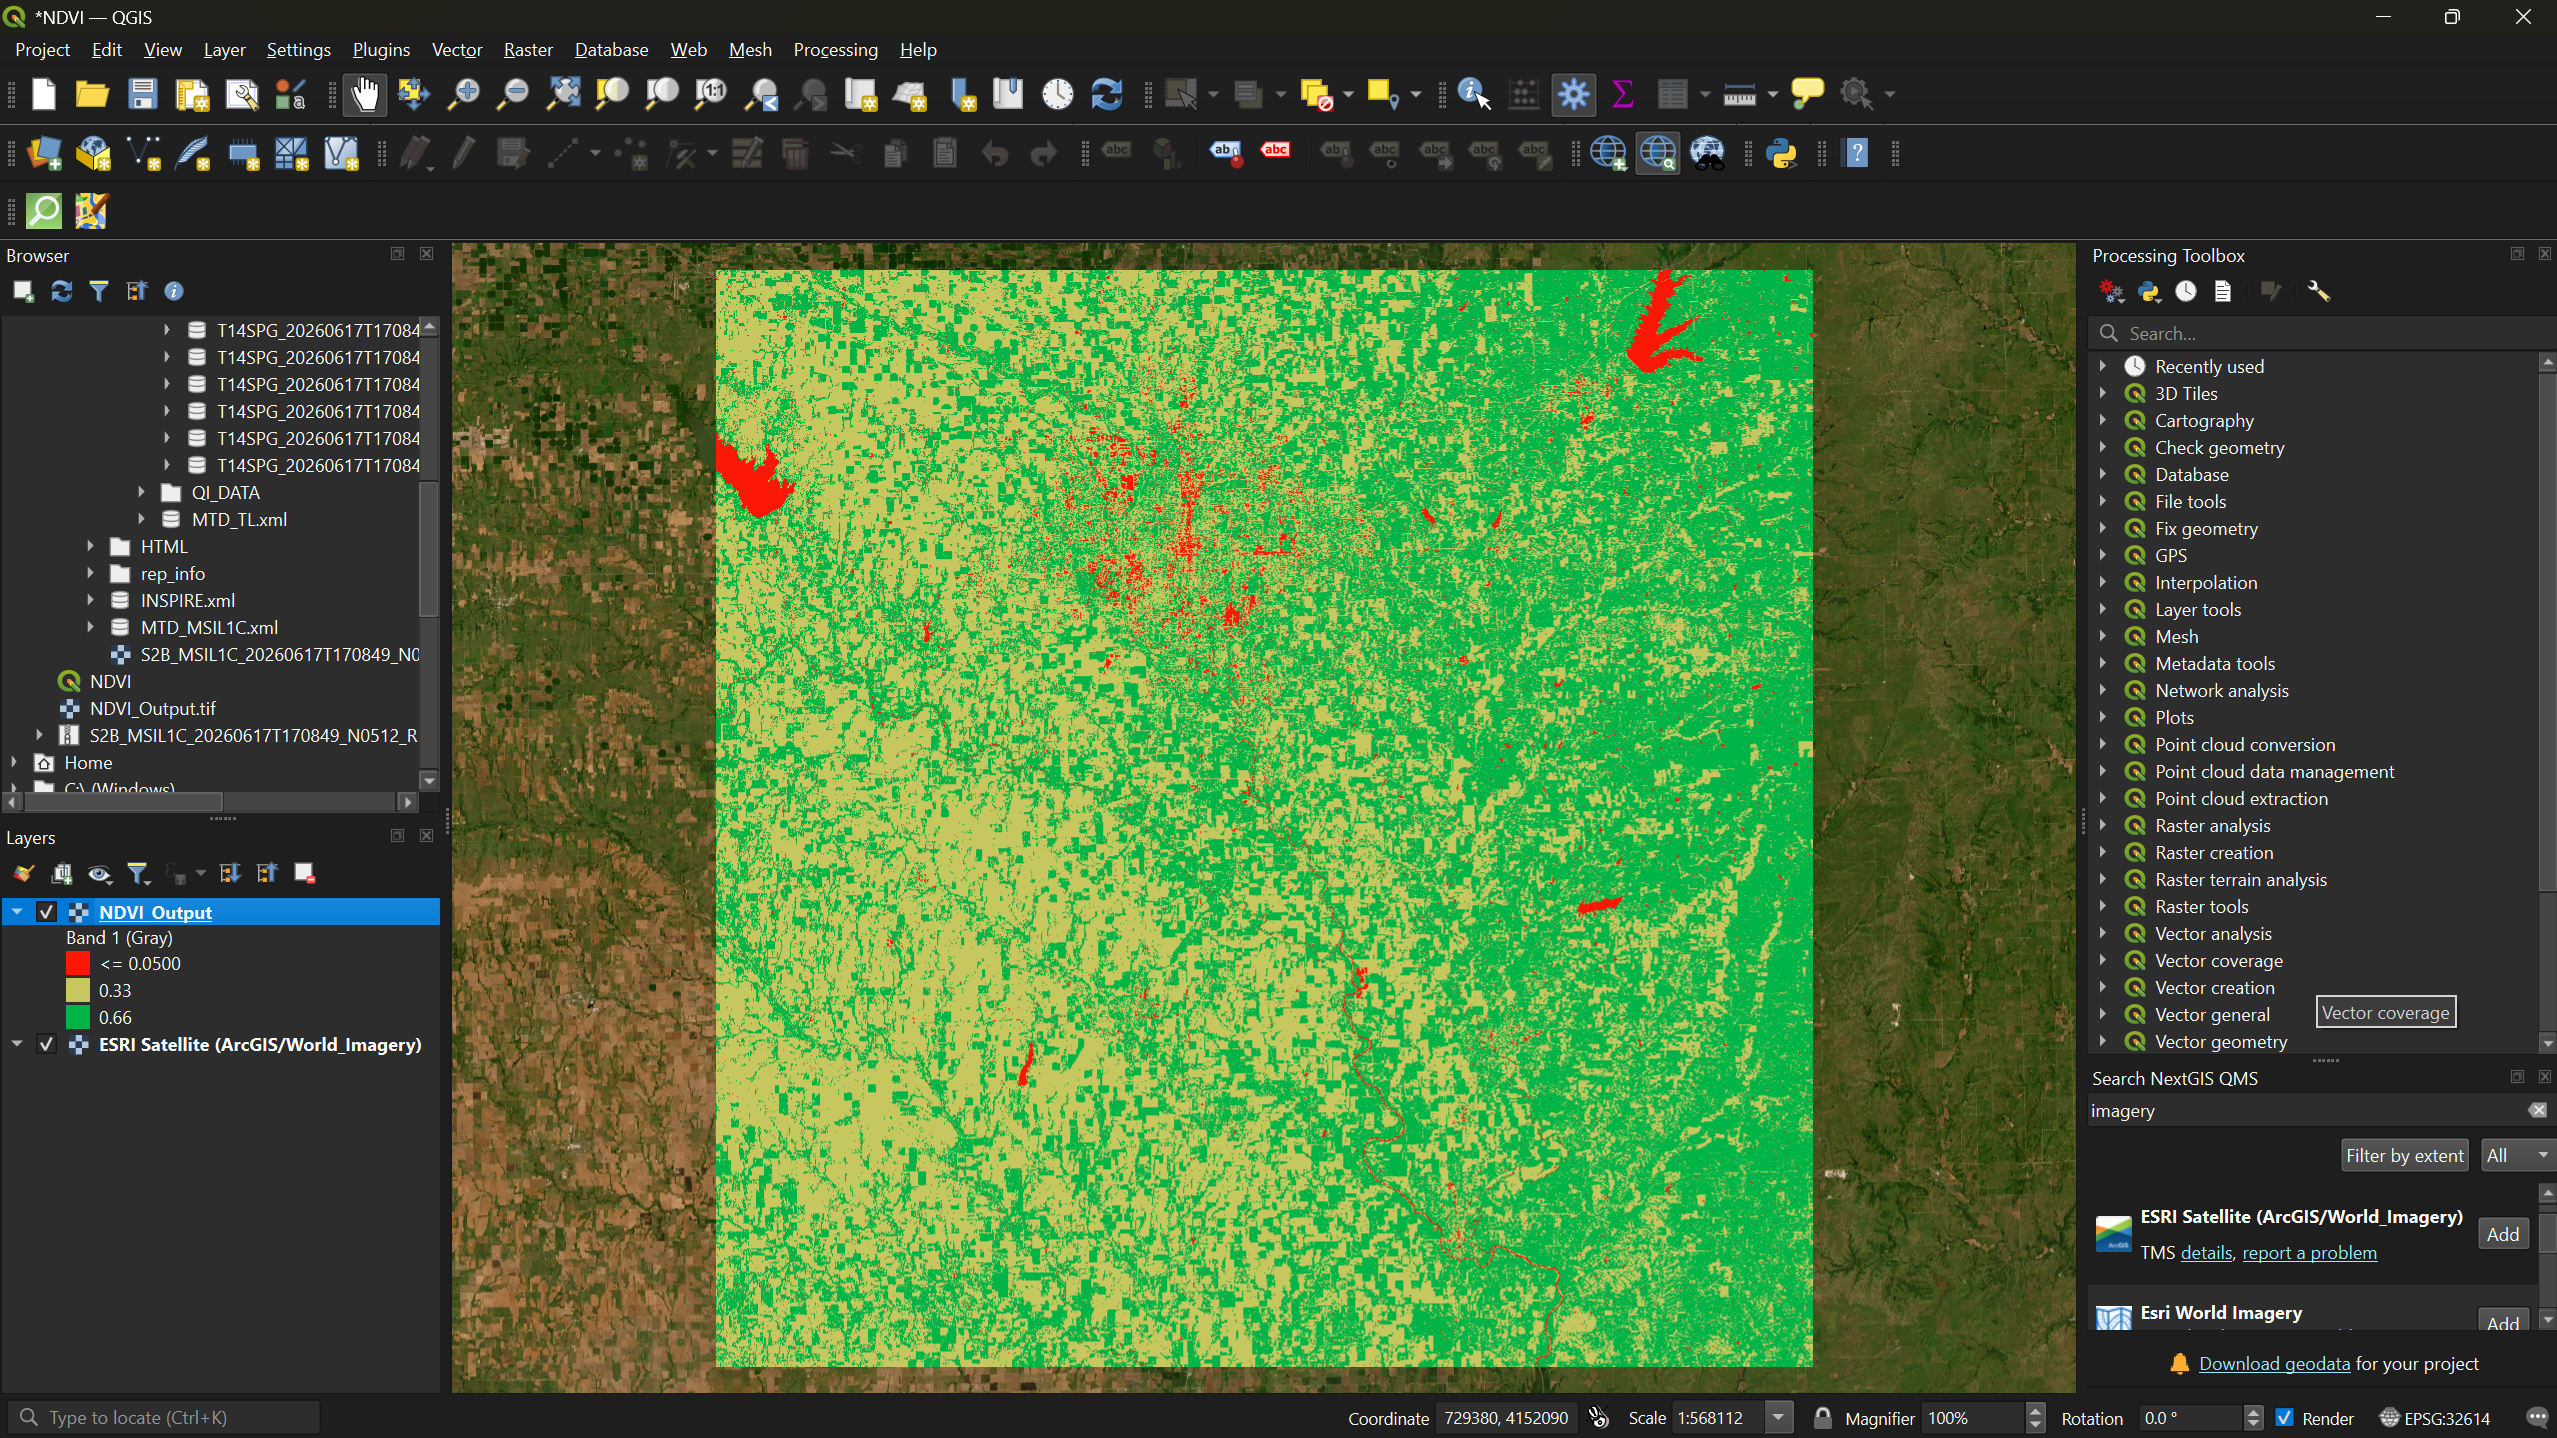
The NDVI layer overlaid on satellite basemap
imagery for comparison.
Exercises: Flood Analysis with False Color Composites and NDWI
Figure 1
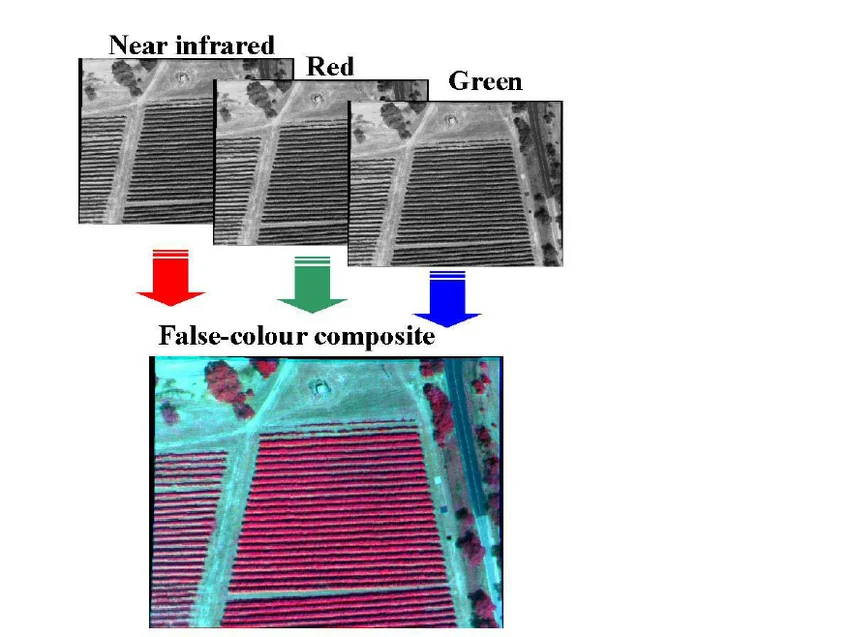
Diagram showing how true color and false color
composites map spectral bands to RGB screen channels differently.
Figure 2
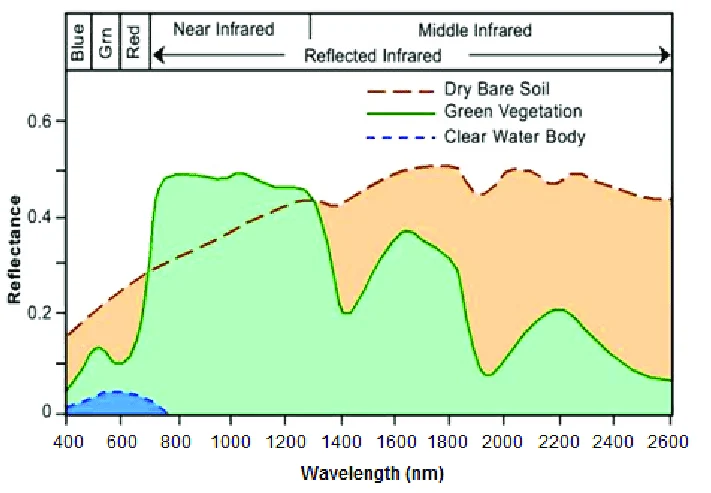
Chart showing reflectance values across
wavelengths for different surface types, illustrating why band
substitution reveals hidden features.
Figure 3
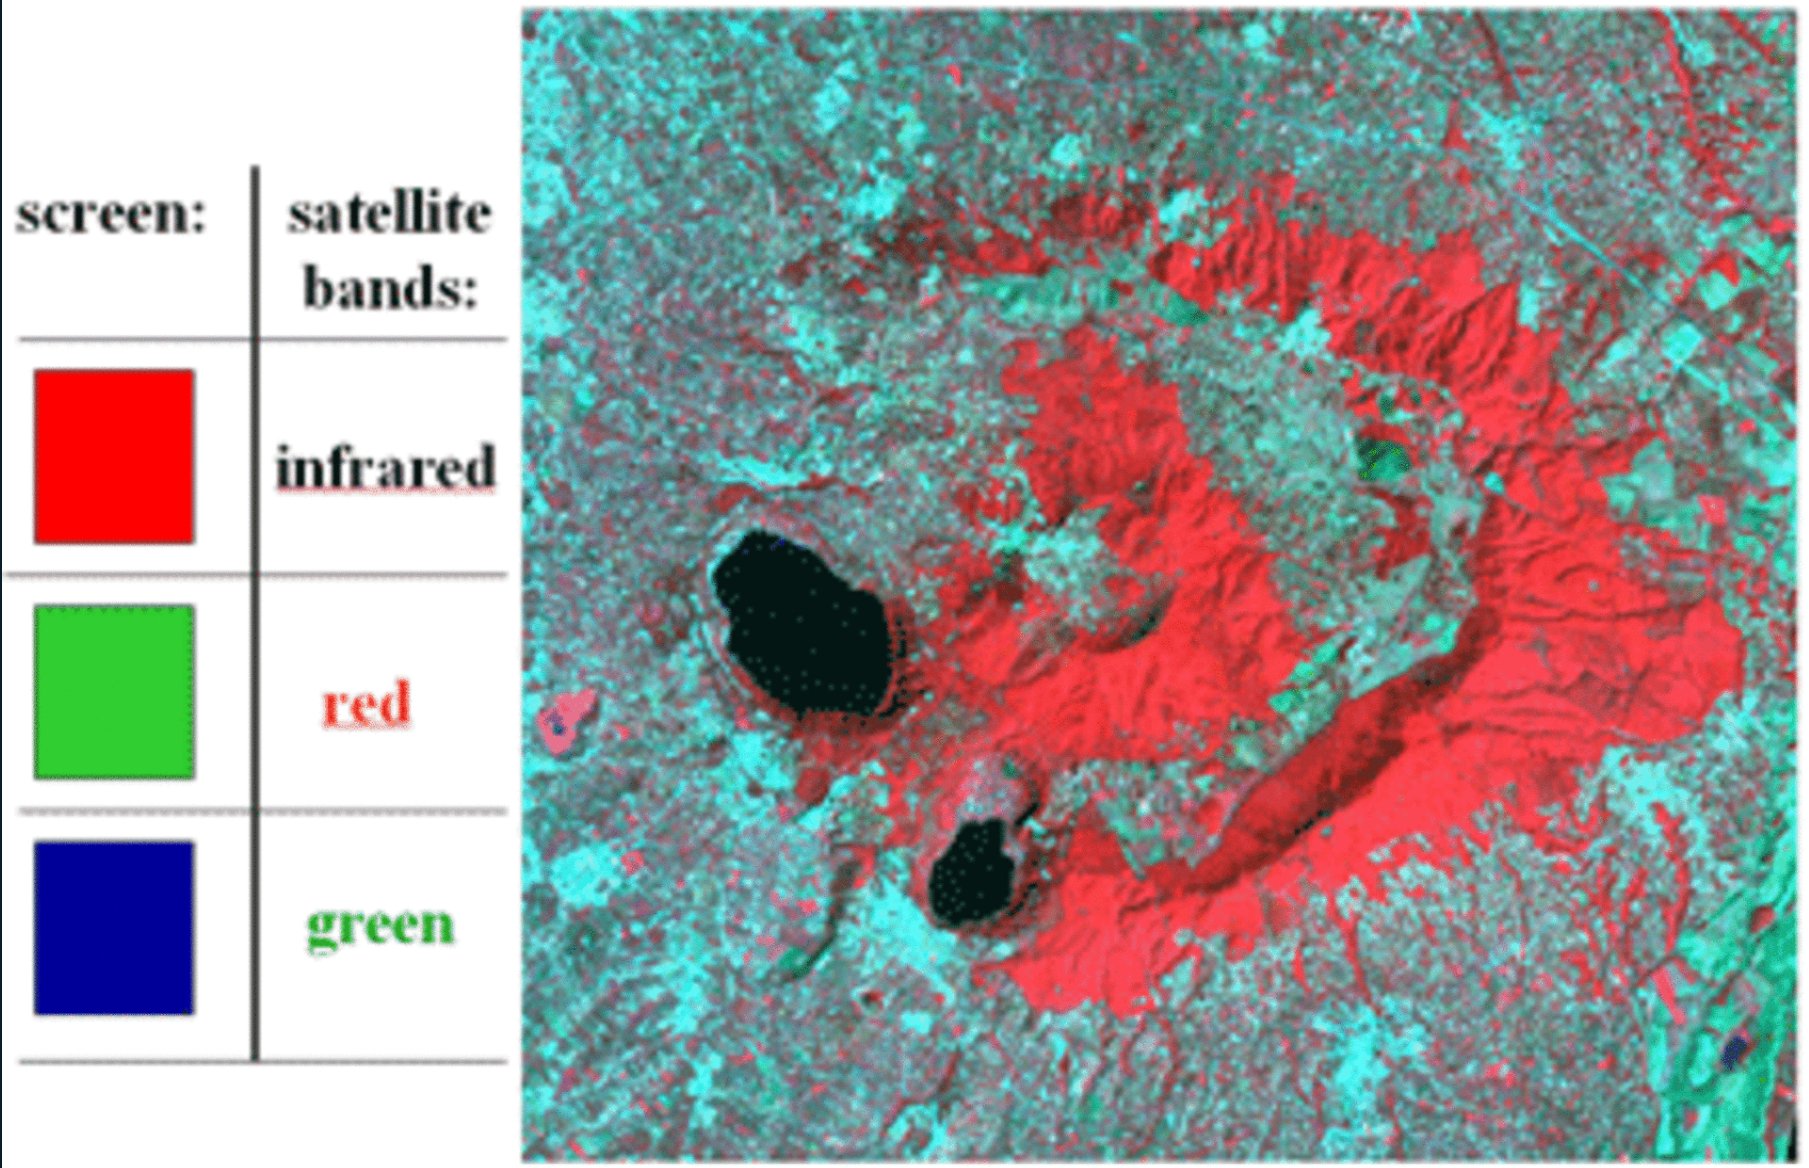
A false color composite example from Sentinel-2
imagery.
Figure 4
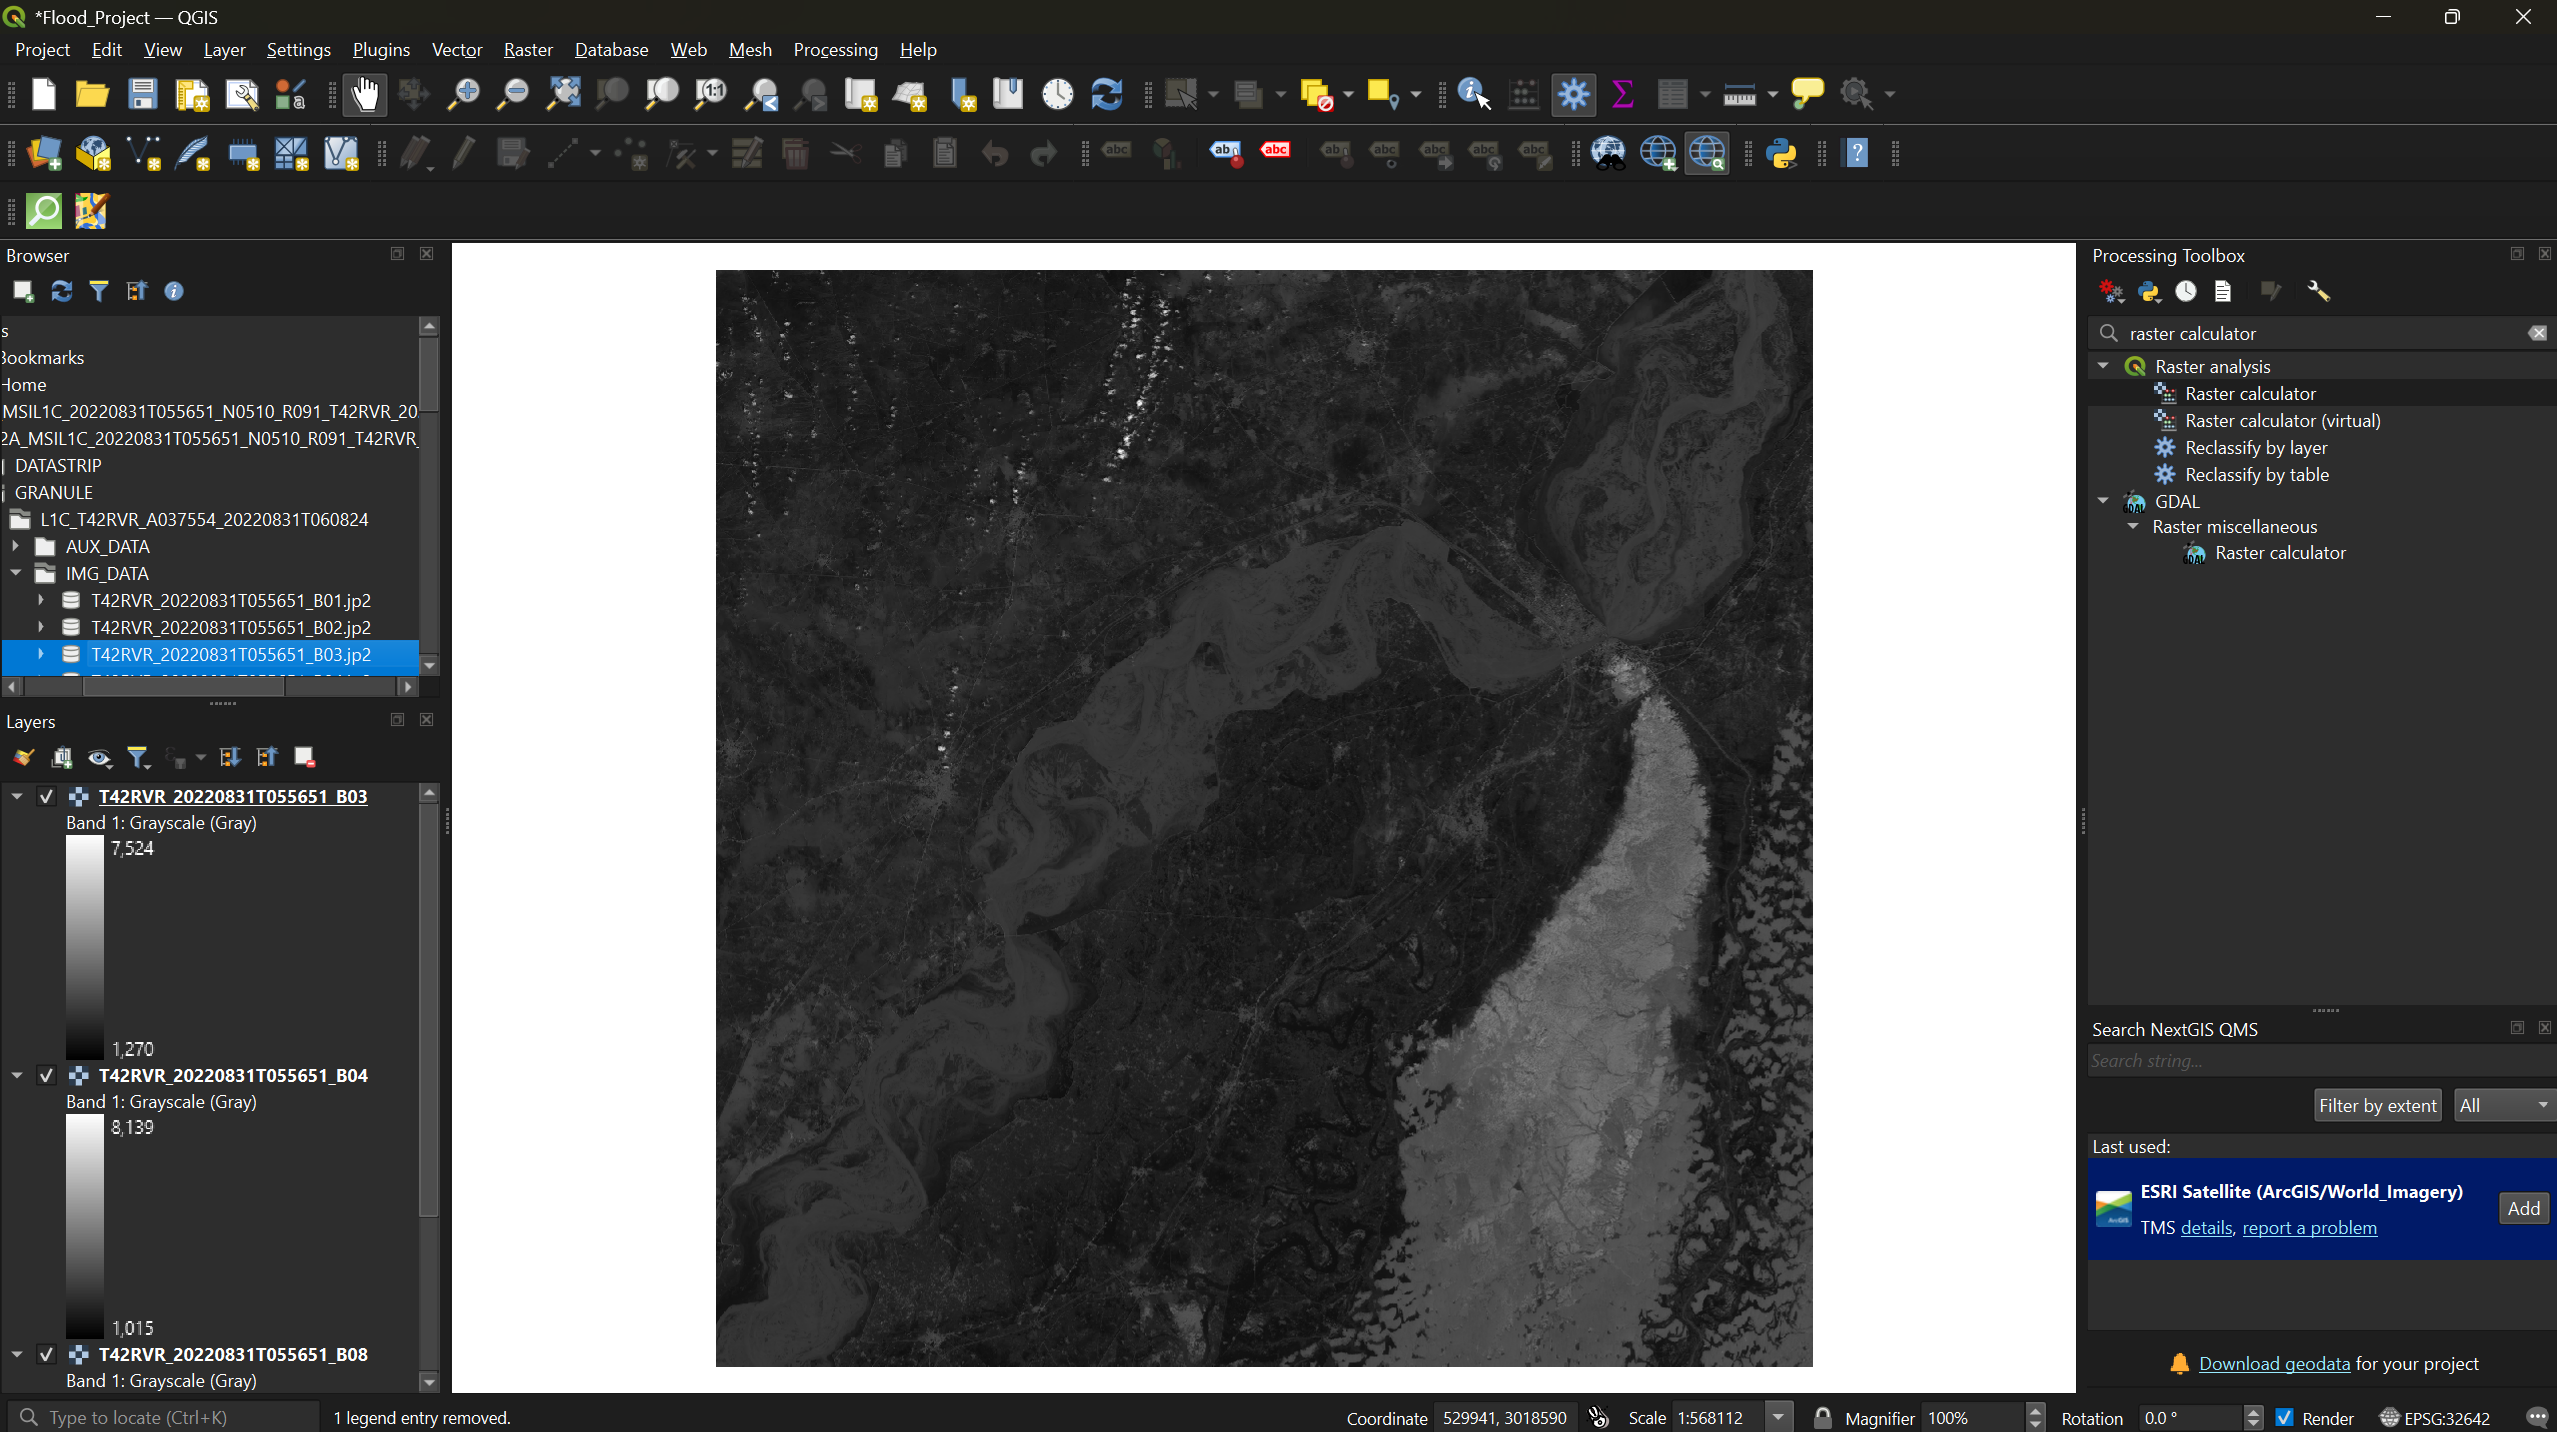
Bands 3, 4, and 8 loaded into QGIS.
Figure 5
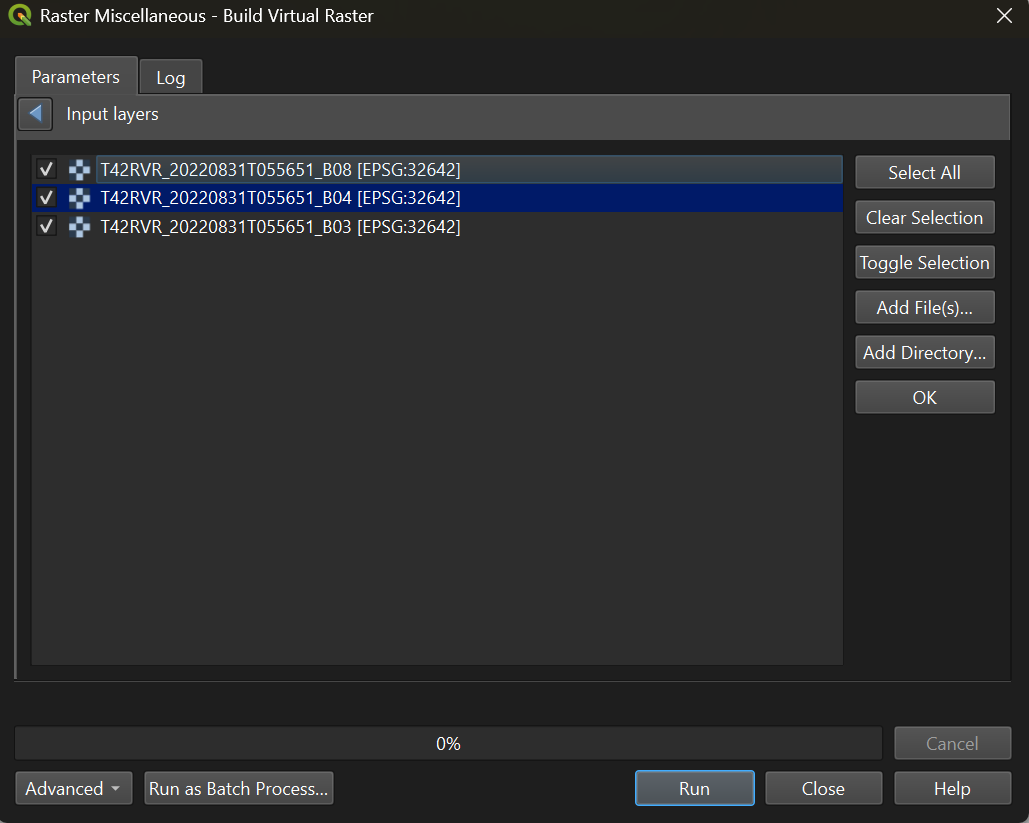
The Build Virtual Raster dialog with bands
arranged in NIR-Red-Green order.
Figure 6
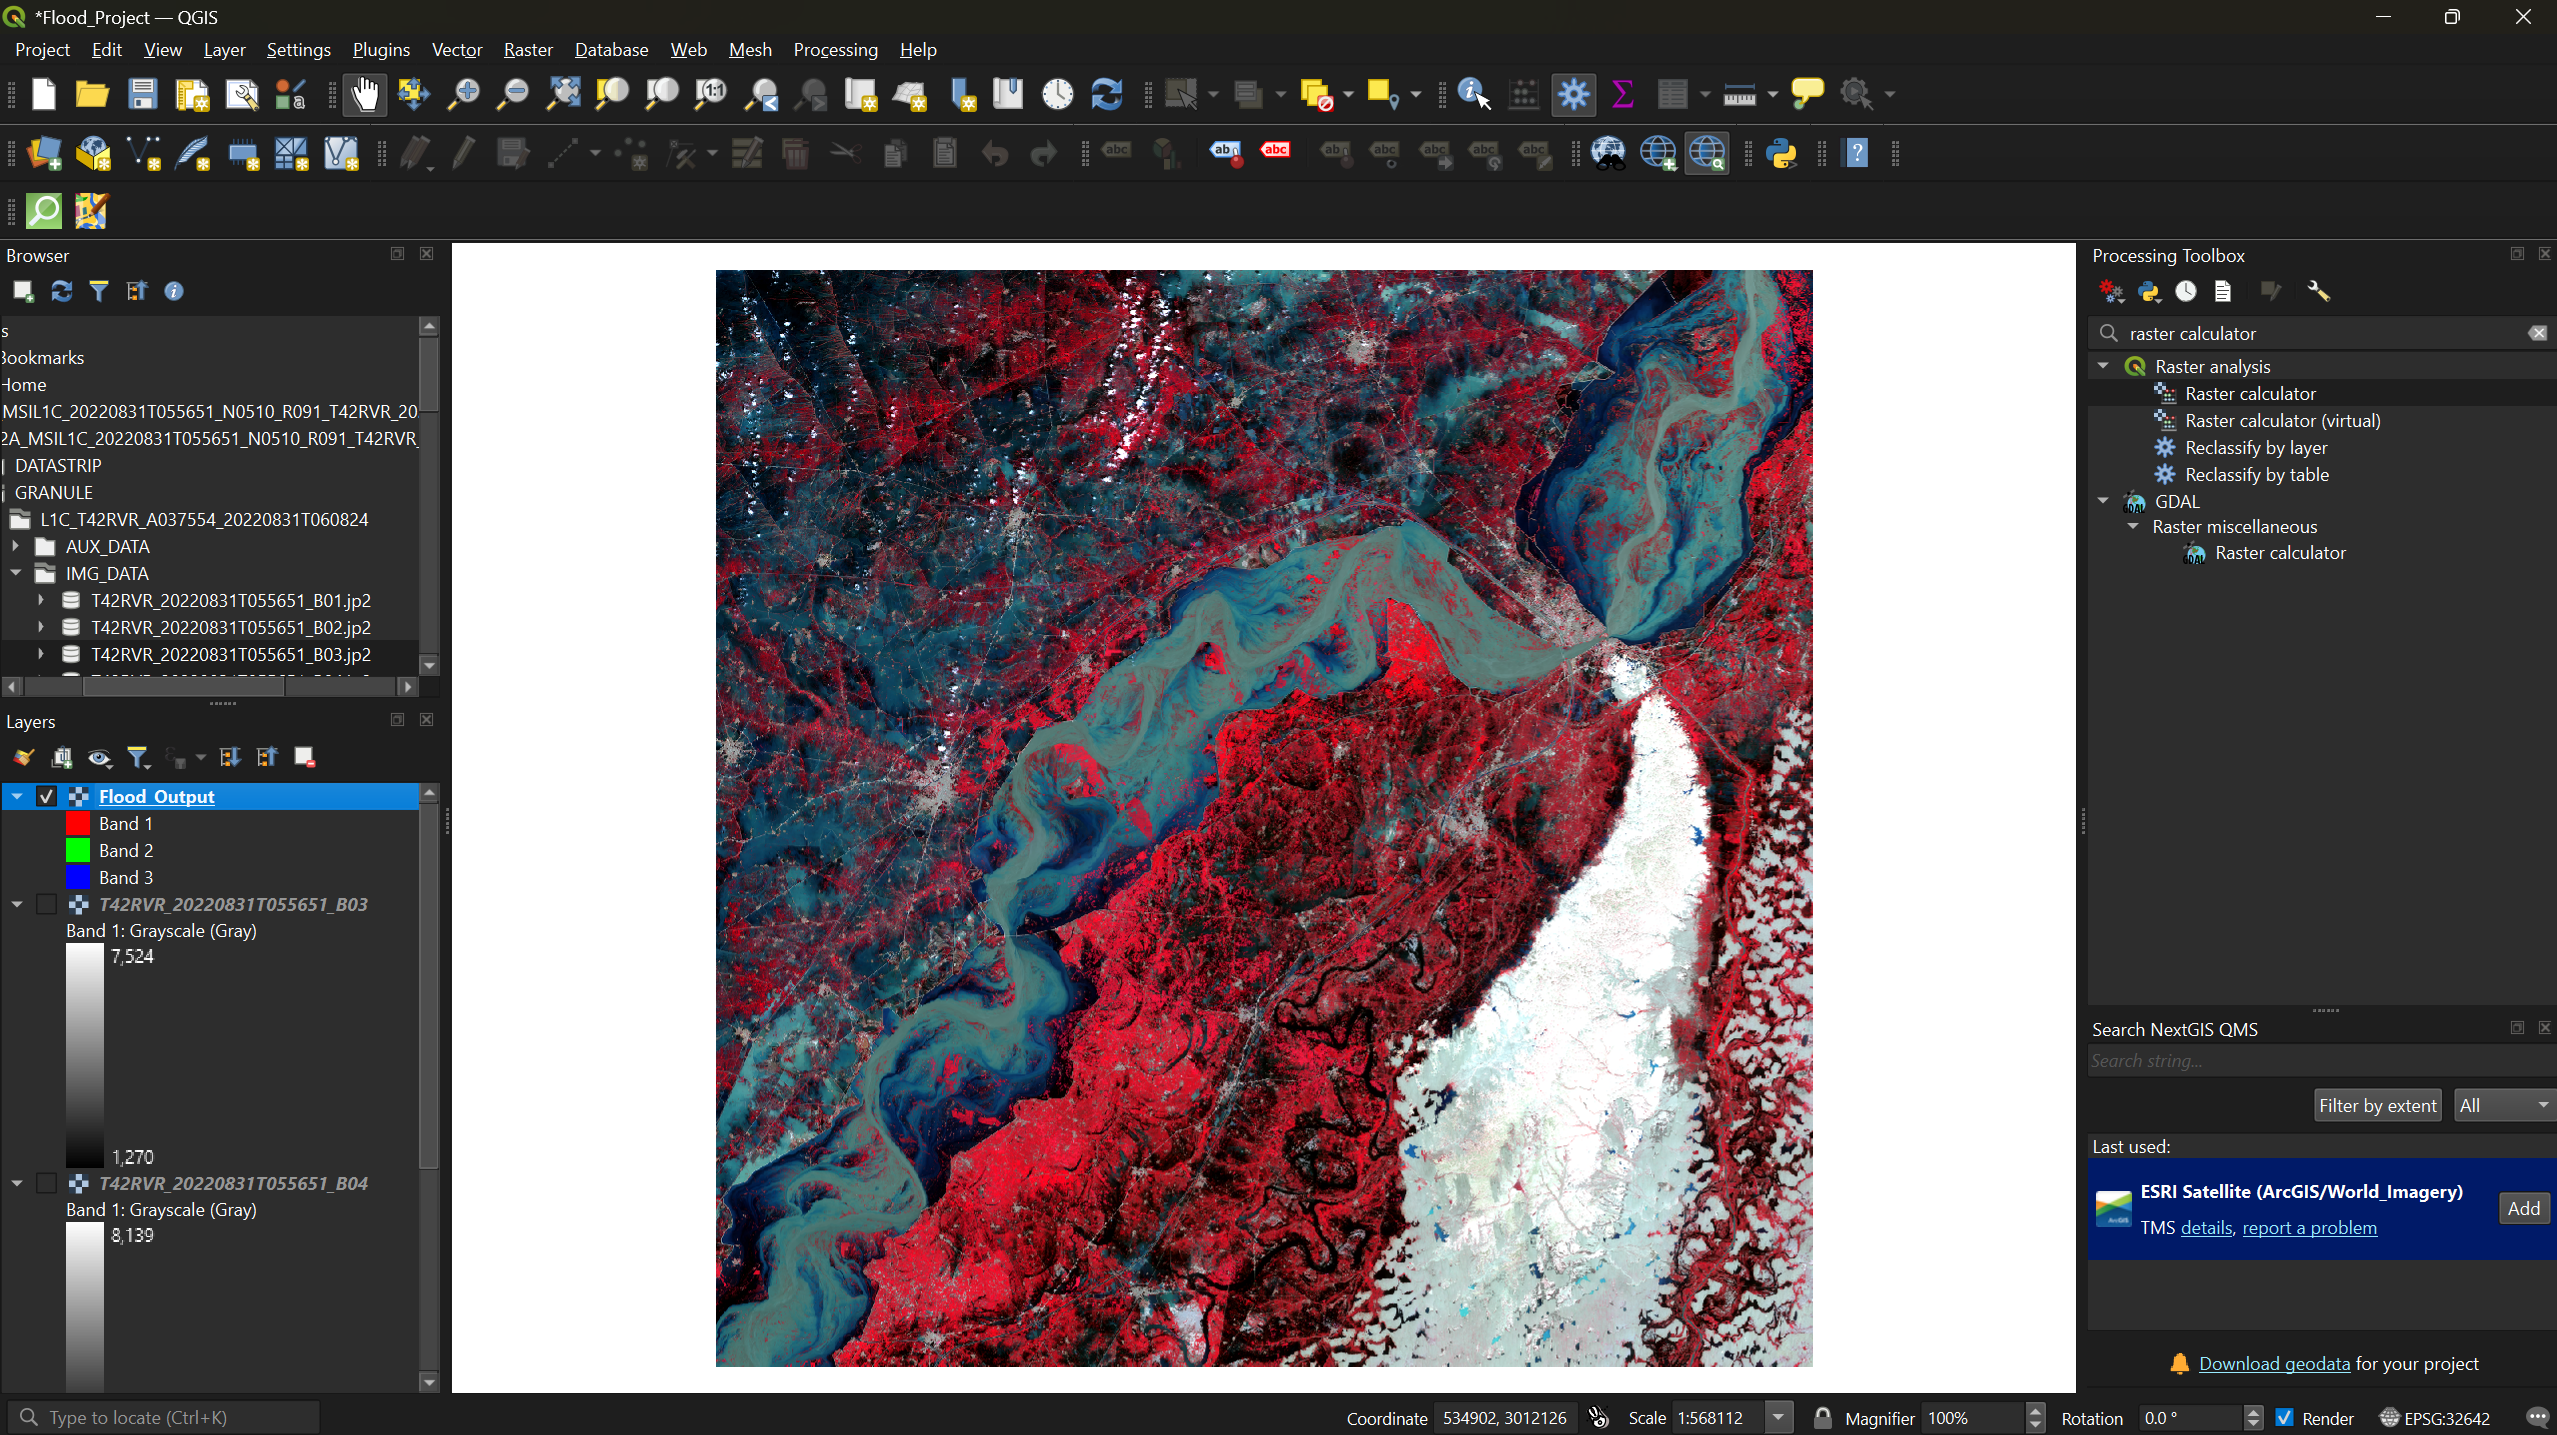
False color composite of the Sindh province
during the 2022 floods.
Figure 7
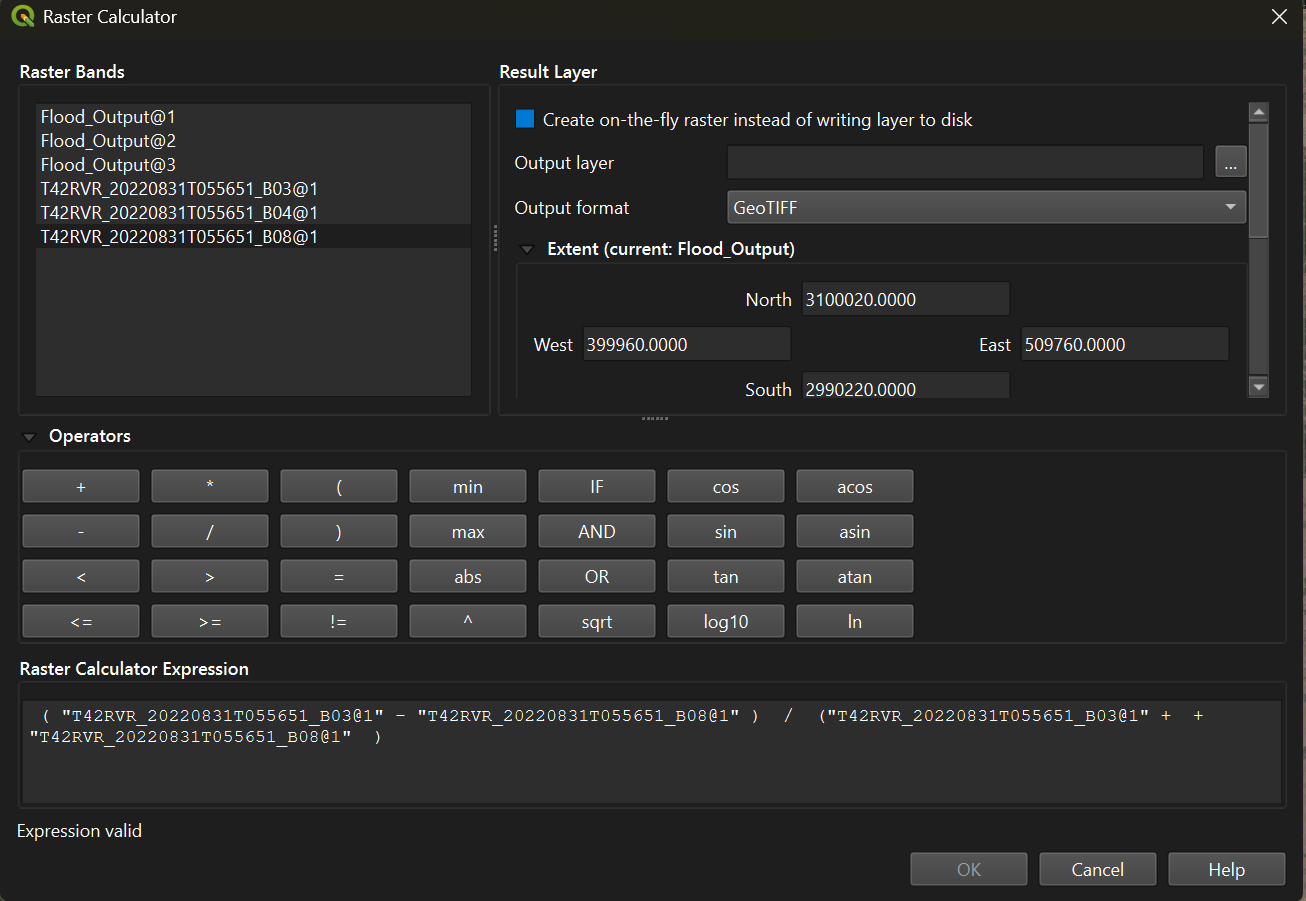
The Raster Calculator with the NDWI expression
entered.
Figure 8
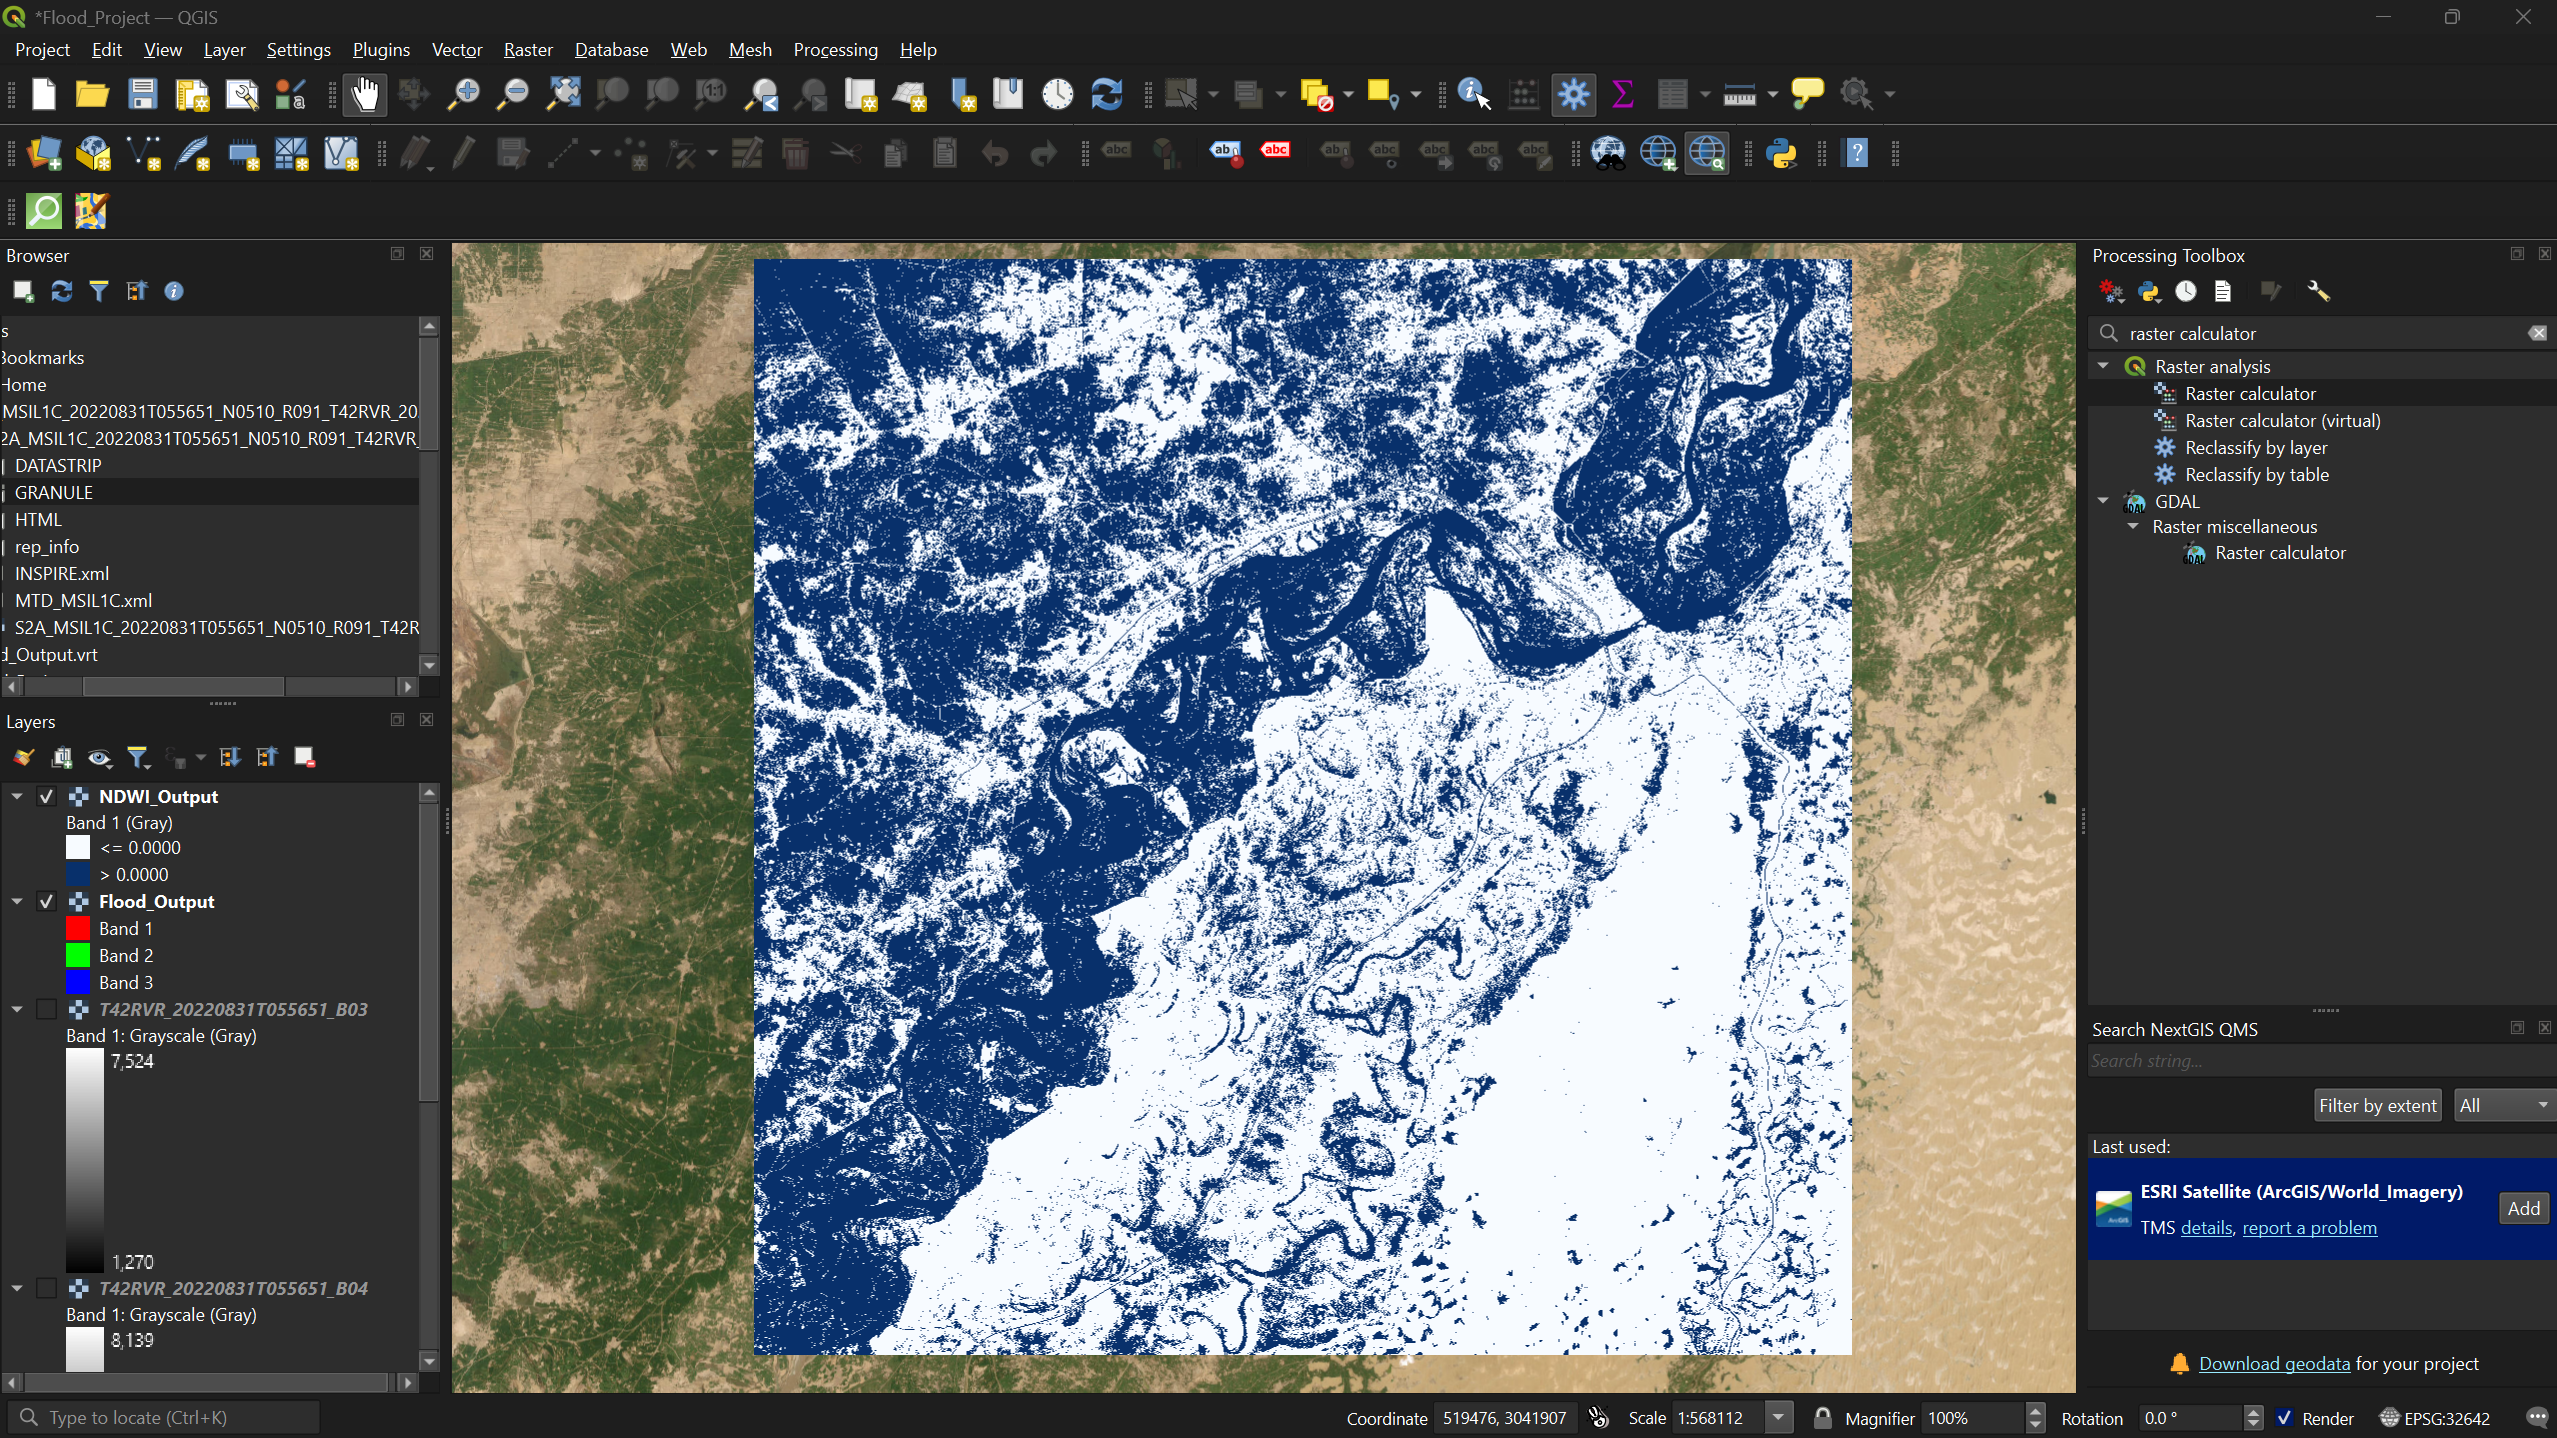
NDWI results with two-class blue symbology
applied.
Figure 9
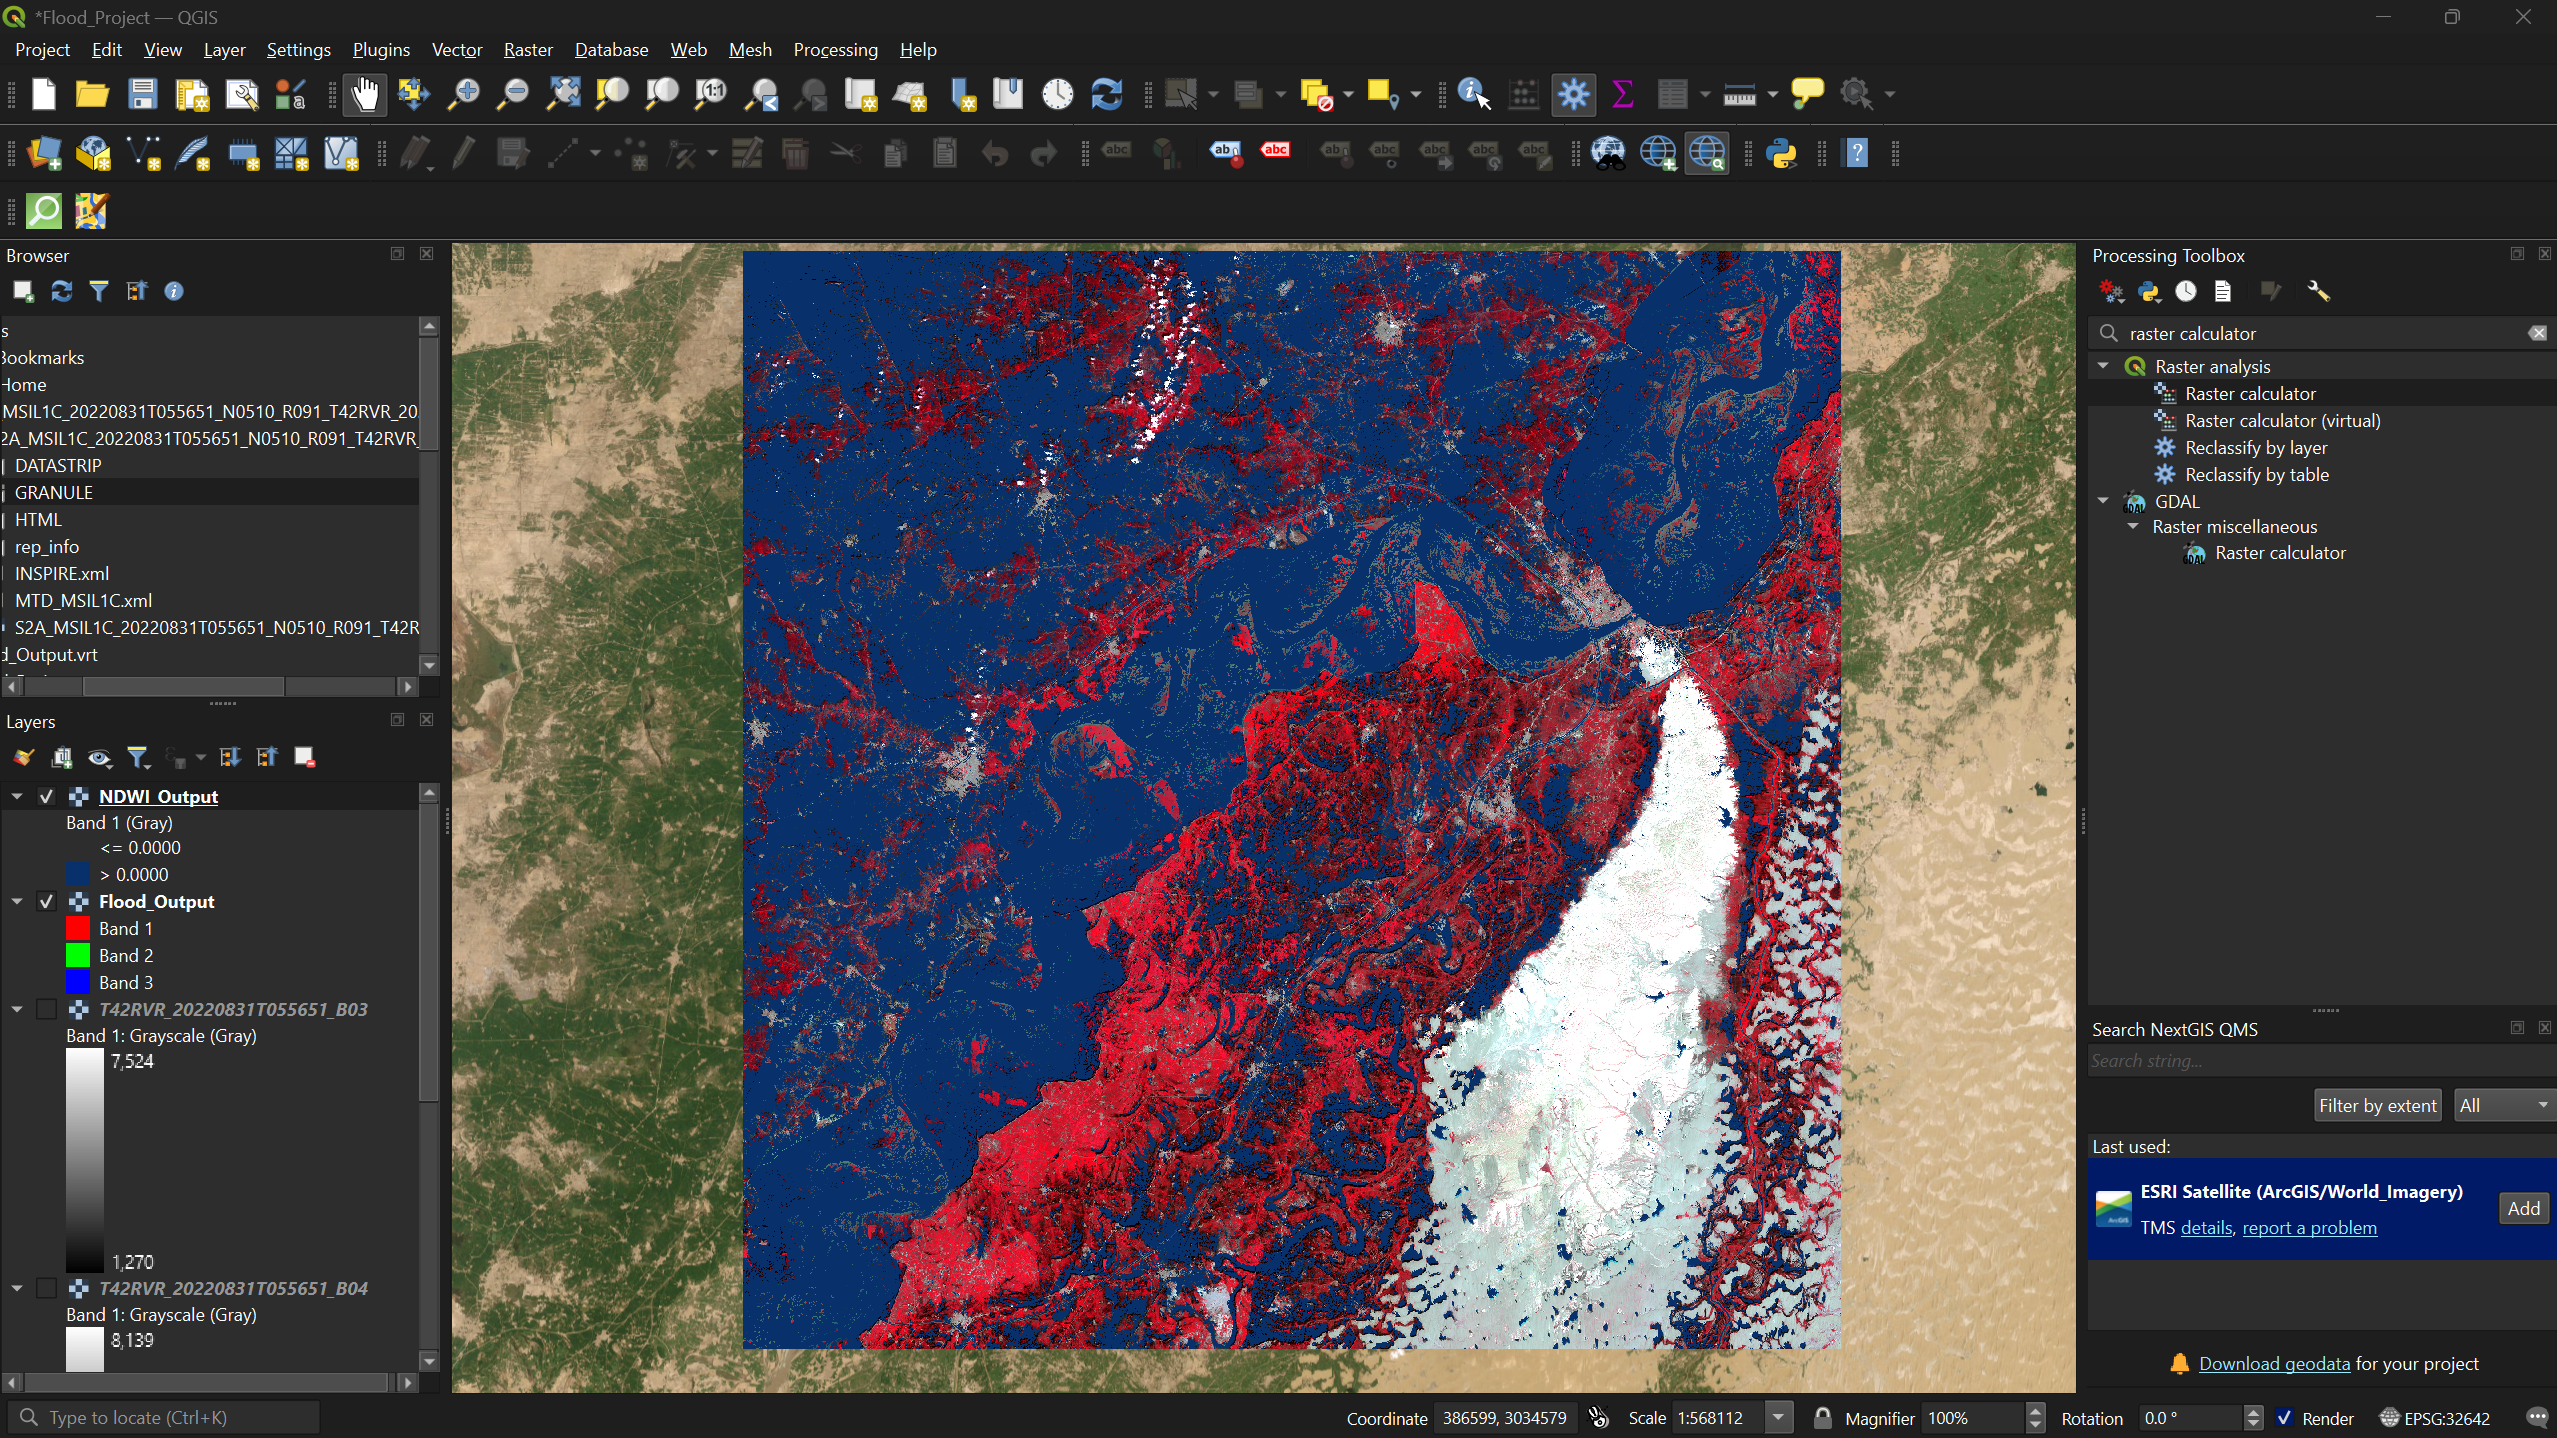
NDWI water detection overlaid on the false color
composite, showing detected flood extent in blue over the FCC.