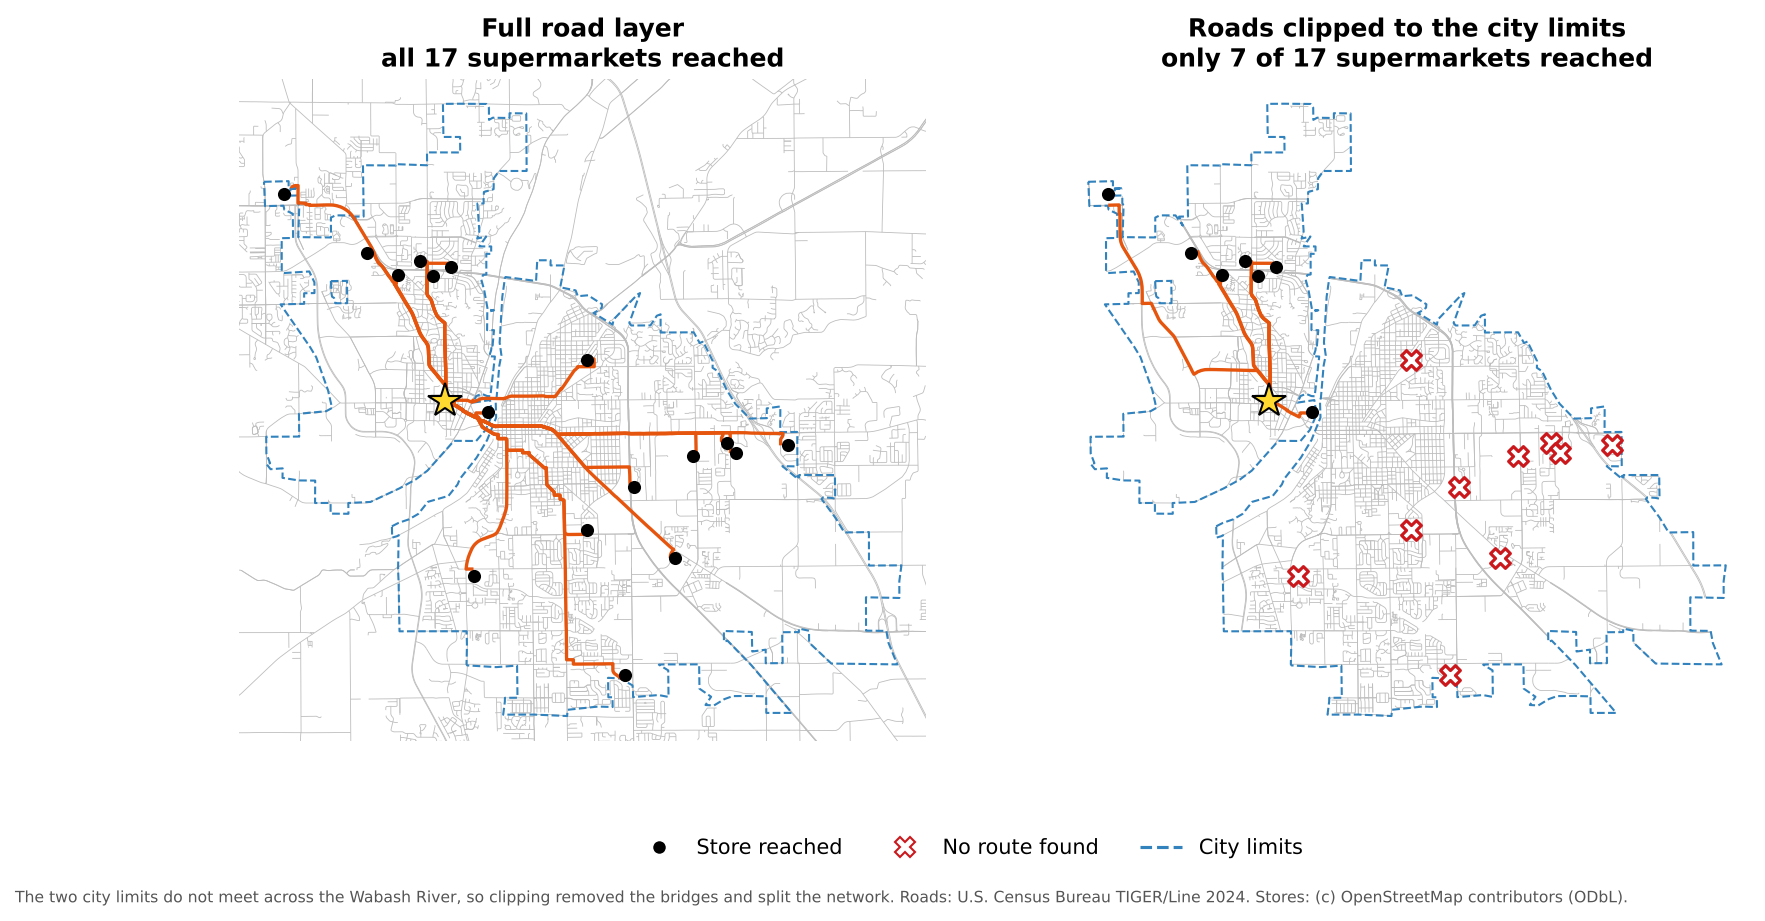
Image 1 of 1: ‘Two maps of Lafayette and West Lafayette. Left: with the full road layer, orange routes run from the origin star in West Lafayette to all 17 supermarkets. Right: with roads clipped to the irregular, dashed city limits, the network is split at the Wabash River and only the 7 supermarkets in West Lafayette are reached; the 10 in Lafayette are marked with red crosses.’
Clipping the roads to the city limits breaks the
network.
Figure 2
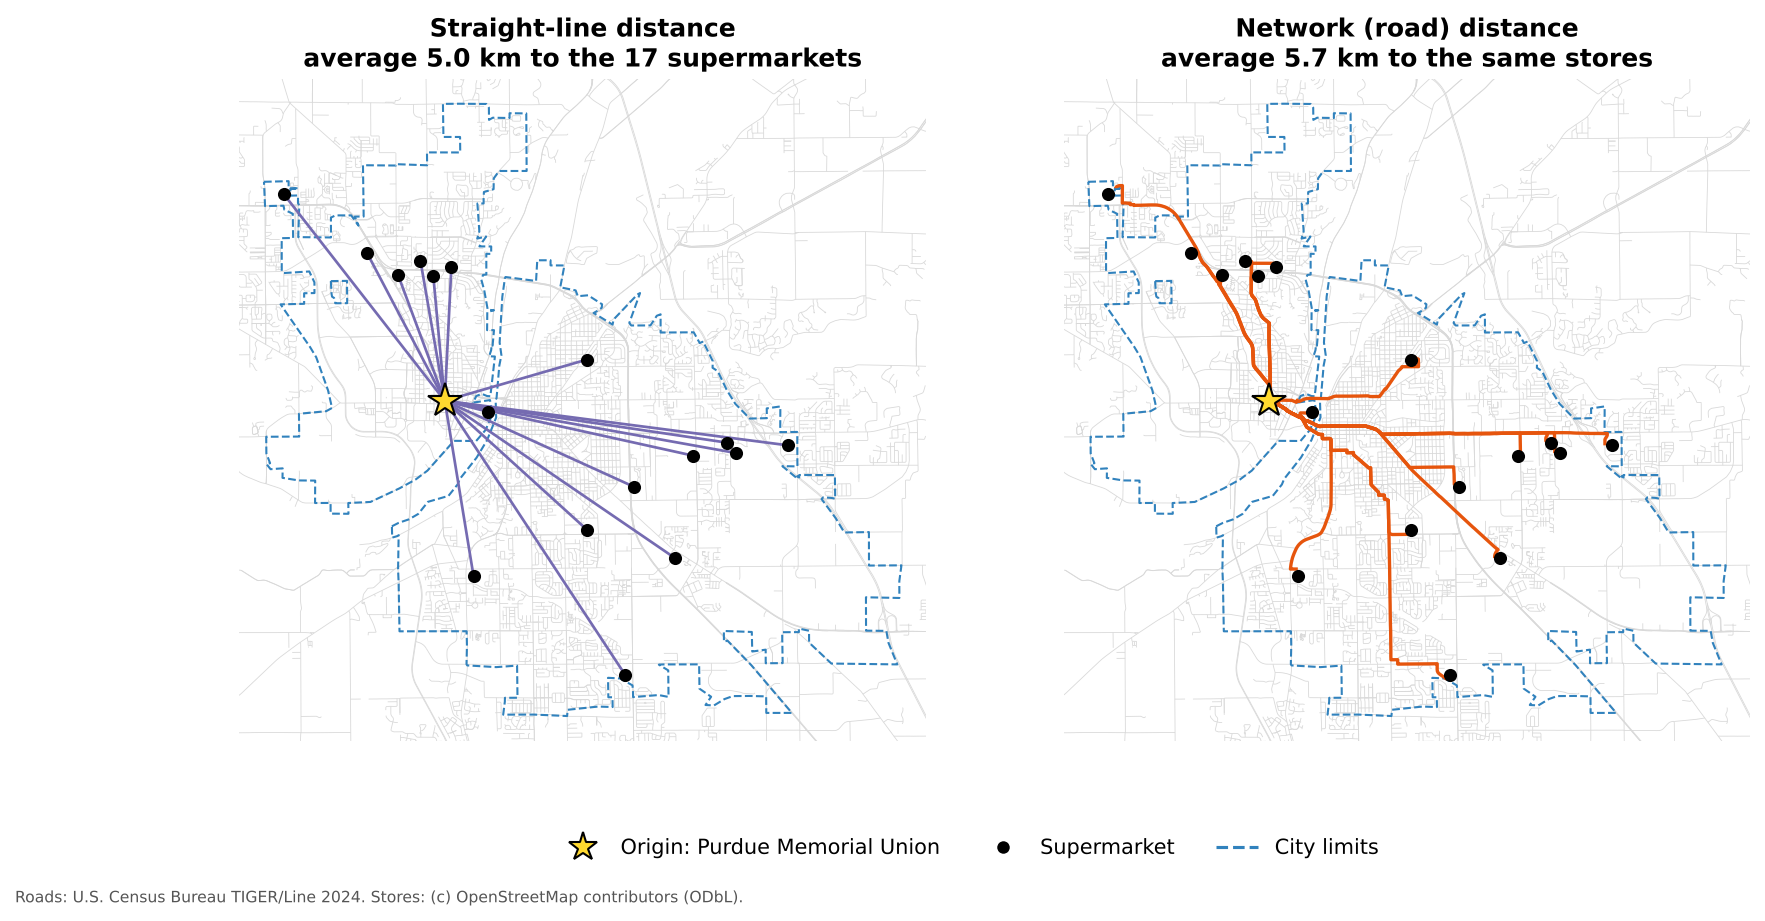
Image 1 of 1: ‘Two maps of Lafayette and West Lafayette with an origin star at the Purdue Memorial Union and 17 black supermarket points. Left: purple straight lines radiate from the origin to each supermarket, averaging 5.0 kilometers. Right: orange routes follow the streets to the same stores, averaging 5.7 kilometers, crossing the Wabash River on the bridges near downtown Lafayette.’
Straight-line distance compared with network
distance.
Figure 3
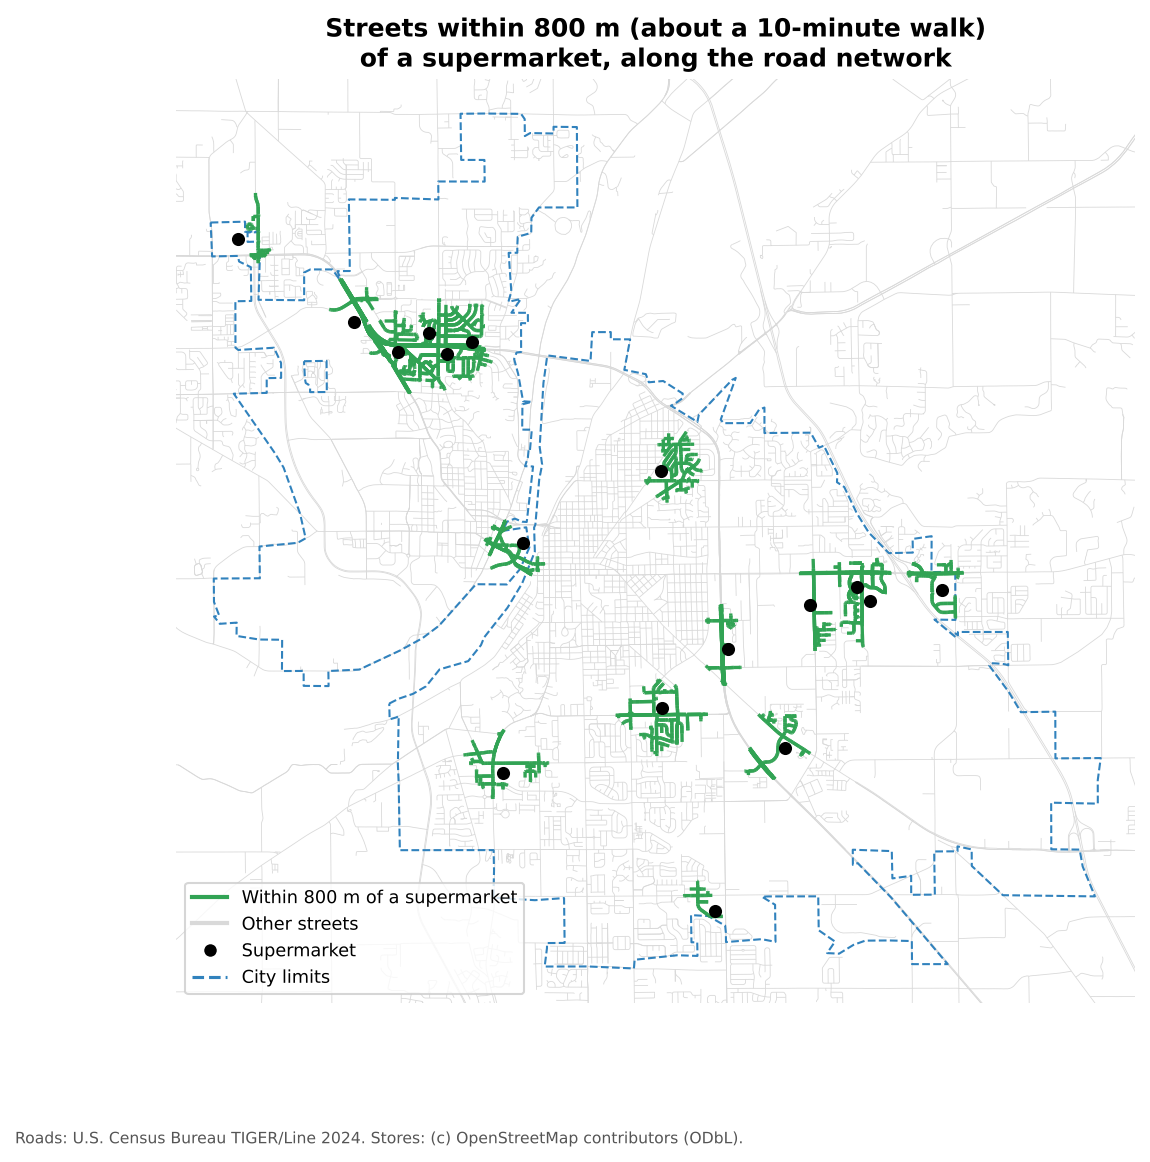
Image 1 of 1: ‘Map of Lafayette and West Lafayette roads in light gray, with green street segments around each of the 17 supermarkets showing the streets within 800 meters along the network. The green areas are small clusters around stores, mostly along the commercial corridors; most streets, including downtown Lafayette and much of the Purdue campus area, are gray.’
Streets within 800 meters of a
supermarket.
Figure 4
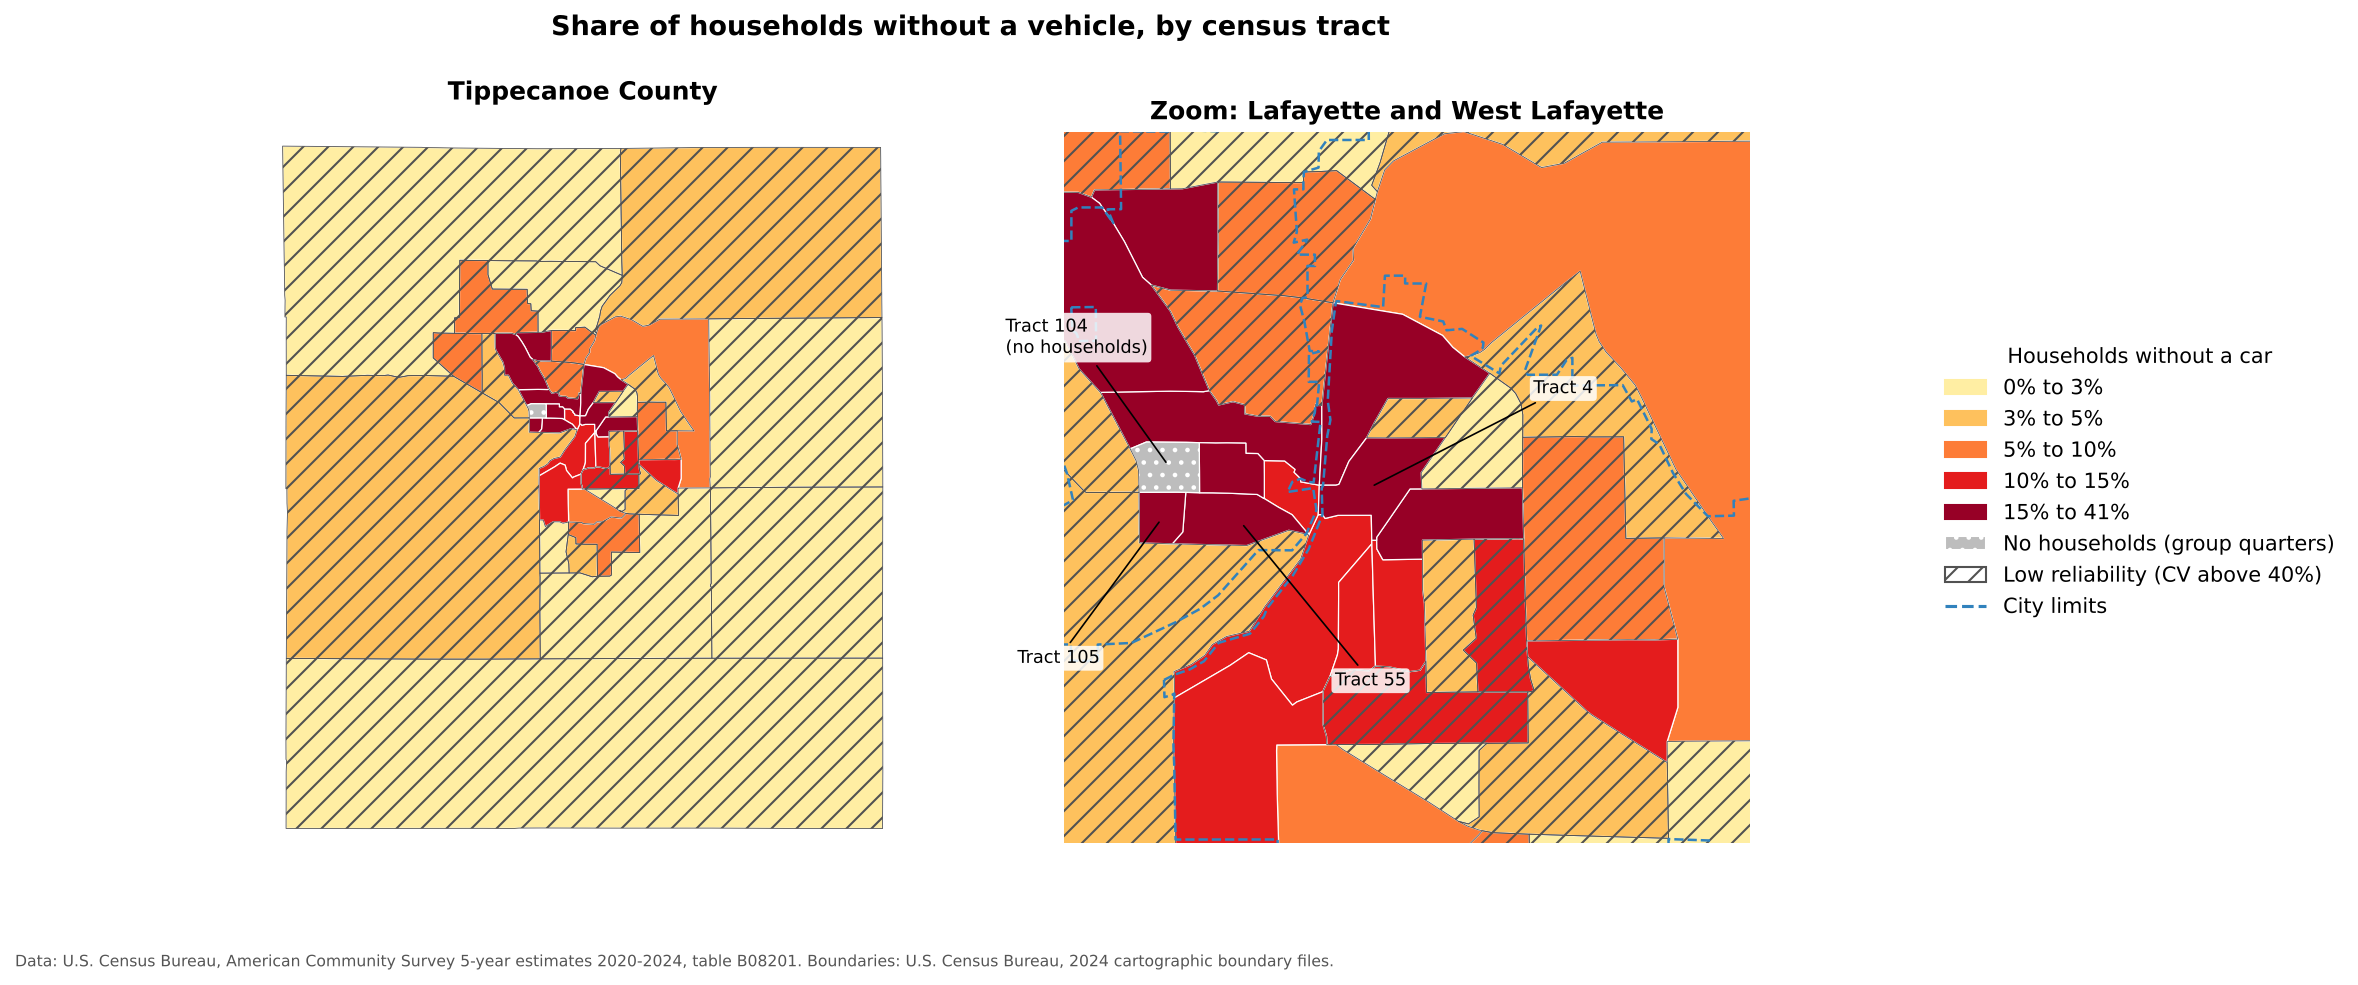
Image 1 of 1: ‘Two choropleth maps of the share of households without a vehicle by census tract, in five classes from light yellow (0 to 3 percent) to dark red (15 to 41 percent). Left, all of Tippecanoe County: rural tracts are light and many are hatched as low reliability. Right, a zoom on Lafayette and West Lafayette: the darkest tracts are near downtown Lafayette and the Purdue campus, such as tracts 4, 55 and 105. Tract 104, on campus, is gray because it has no households.’
Households without a vehicle by census tract in
Tippecanoe County.