All Images
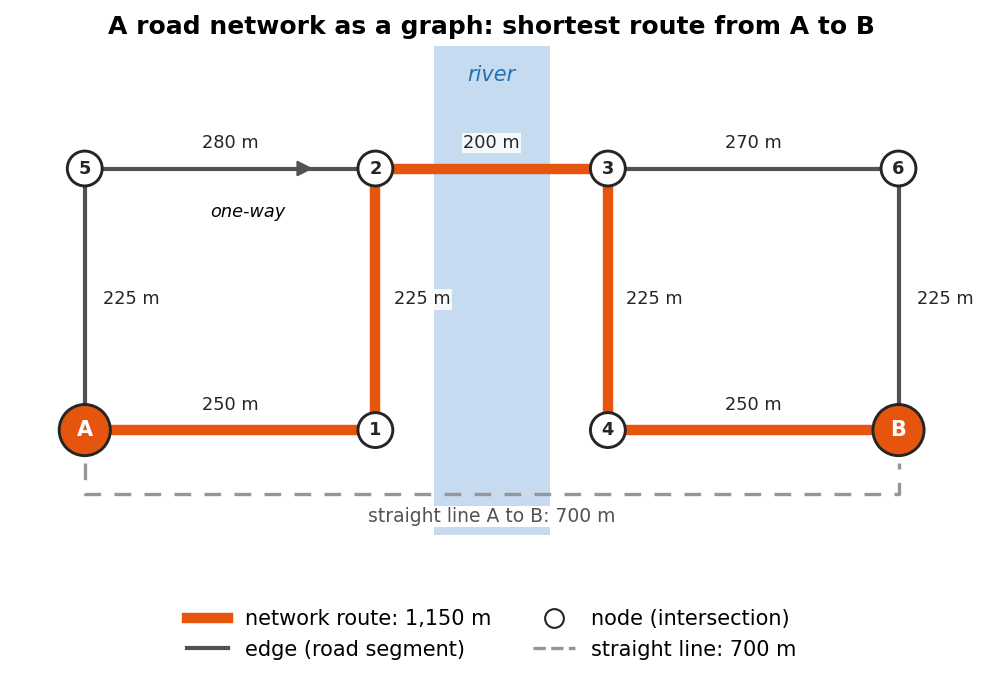
Network Analysis
Figure 1
Image 1 of 1: ‘Diagram of a small road network with eight intersections (nodes), the start A, the end B and six numbered ones, joined by road segments (edges), each labeled with its length in meters. A one-way street is drawn with an arrow. A dashed gray bracket under the network marks the straight-line distance from A to B, 700 meters. A thick orange line follows the edges from A to B along the shortest route, labeled network route, 1,150 meters, because a river with only one bridge forces a detour.’
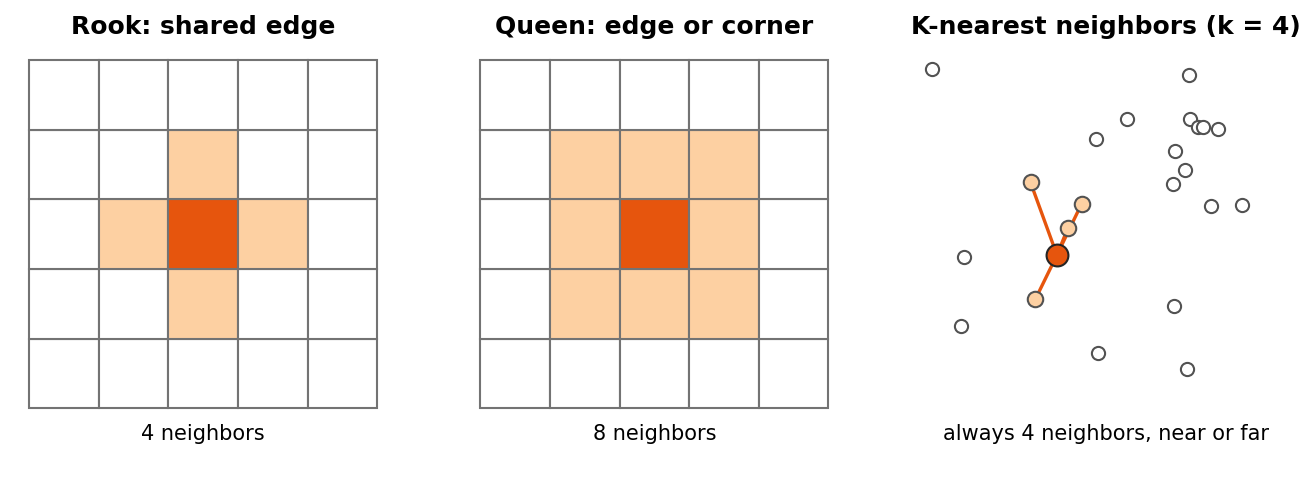
Spatial Autocorrelation with PySAL
Figure 1
Image 1 of 1: ‘Three panels. Left, Rook contiguity: a 5 by 5 grid of square cells with the center cell in dark orange and the four cells sharing an edge with it (above, below, left and right) in light orange. Middle, Queen contiguity: the same grid with the eight surrounding cells, including the diagonal corners, in light orange. Right, K-nearest neighbors with k equal to 4: scattered points of uneven spacing, one dark orange point joined by lines to its four closest points; the number of neighbors is always four, however near or far they are.’
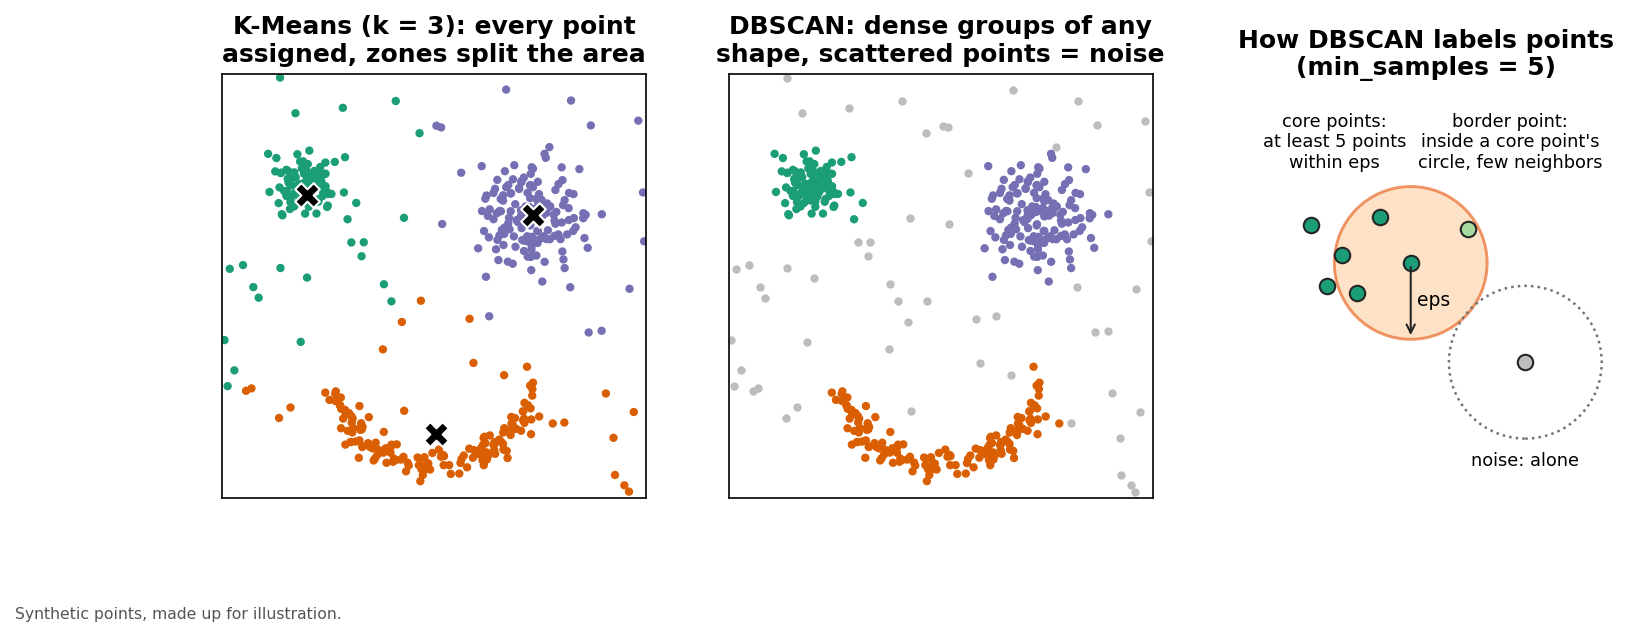
Spatial Clustering
Figure 1
Image 1 of 1: ‘Three panels of the same synthetic points: three dense groups of different sizes and shapes, one of them long and curved, plus scattered points across the whole area. Left, K-Means with k equal to 3: every point is colored, the area is split into three regions, and the scattered points are assigned to the nearest group. Middle, DBSCAN: the three dense groups are colored, the curved group is kept whole, and the scattered points are gray noise. Right, a close-up explaining DBSCAN with a circle of radius eps around points: core points with at least five points inside a circle of radius eps, a border point inside a core point's circle but with few neighbors of its own, and an isolated noise point.’
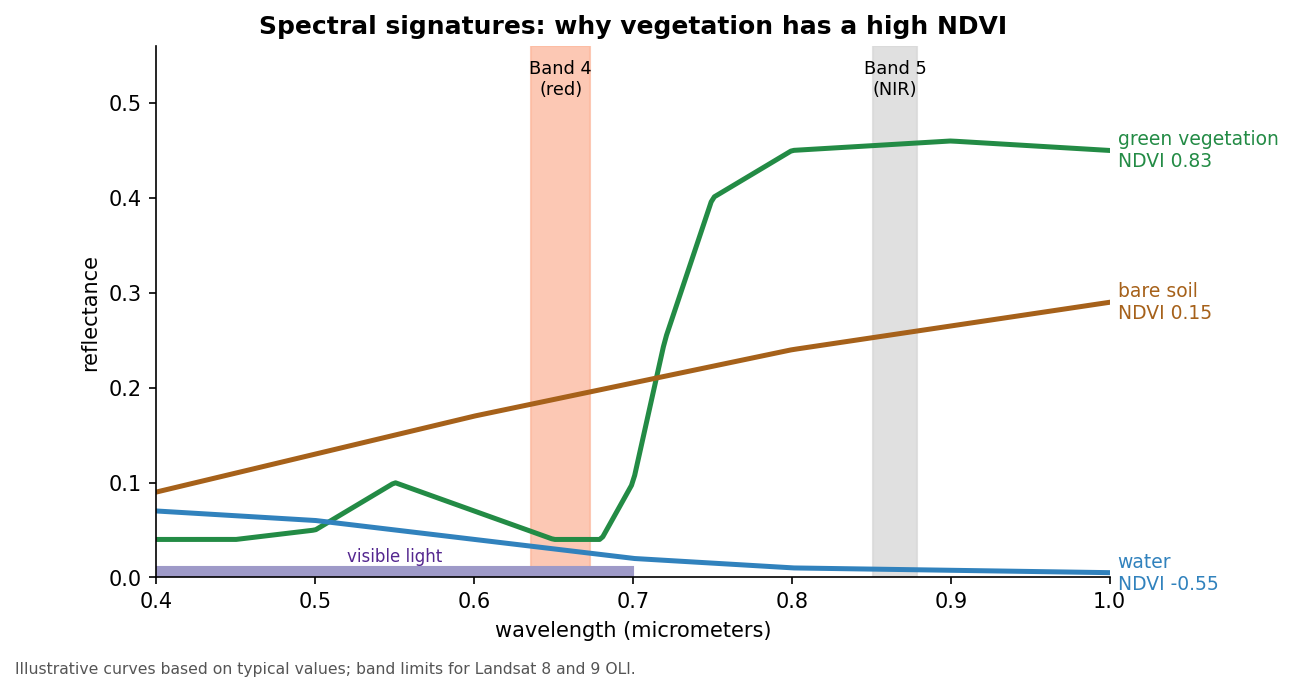
NDVI Analysis
Figure 1
Image 1 of 1: ‘Line chart of reflectance (0 to 0.5) against wavelength (0.4 to 1.0 micrometers), with illustrative curves. Green vegetation is low in blue and red, with a small bump in green, then rises steeply after about 0.7 micrometers to about 0.45 in the near infrared. Bare soil rises gently from about 0.1 to 0.3. Water is low everywhere and falls to almost 0 in the near infrared. Two shaded bands mark Landsat 8 and 9 Band 4 (red, about 0.64 to 0.67 micrometers) and Band 5 (near infrared, about 0.85 to 0.88 micrometers). Labels give the resulting NDVI: vegetation 0.83, soil 0.15, water minus 0.55.’